Buffer Beef
AQR casts doubt on buffer ETFs. FT Vest fires back. Who is right?

I’ll try to keep this short, as I’ve already written a lot about buffer ETFs lately (here, here, and here): AQR recently put out a commentary that called buffer ETFs into question on empirical (i.e., they don’t really improve on traditional allocations) and theoretical (i.e., “If the duration of the drawdown doesn’t align with the maturity of the option, the hoped-for protection won’t be there.”) grounds.
One of the leading buffer ETF providers, FT Vest, predictably took exception and published a rebuttal that challenged AQR’s findings. FT Vest’s main critique seems to be that AQR missed the point — that this isn’t about traditional measures of risk/return but rather some of the psychological and behavioral benefits buffer ETFs can confer when compared to traditional allocation approaches. (FT Vest also does some flexing about innovation, etc. which seems largely beside the point.)
Not trying to referee this, but I did take a look at the buffer ETFs that existed in Jan. 2020 and survived through Jan. 2025, the start and end dates of AQR’s study. (AQR appears to have included non-buffer funds in its analysis but I limited my scope to buffer ETFs alone.) I calculated each buffer ETF’s beta vs. its primary prospectus benchmark over that period. Then I created a custom benchmark that consisted of an ETF that tracked that buffer ETF’s prospectus benchmark index (its weight was set equal to the beta) and a T-bill ETF (which got the remaining weight).
Here’s how the buffer ETFs fared when I compared their performance to that of the custom benchmarks I’d created.
To summarize the results:
The average buffer ETF earned 7.5% per year over this span (median = 7.7% p.a.; max = 10.8%; min = -0.9%)
7 of the 41 buffer ETFs outperformed their custom benchmark; the other 34 lagged (-1.1% p.a. average excess return)
Every buffer ETF was more volatile than its custom benchmark (10.1% average standard deviation vs. 9.8% for average custom benchmark)
Around half of the buffer ETFs had a shallower maximum drawdown than its custom benchmark (average buffer’s max drawdown was about -13.8% vs. -13.7 on average for the custom benchmarks)
4 of the 41 buffer ETFs had a higher Sharpe Ratio than their custom benchmark
This doesn’t look too good for buffer ETFs and seems to broadly align with AQR’s findings. But there are a few things to keep in mind. First, I set each ETF’s custom benchmark with the benefit of hindsight. That is, an investor in the, say, Innovator US Equity Buffer - Sept ETF almost certainly wouldn’t have known in Jan. 2020 that its subsequent performance would approximate that of a portfolio split 71/29% between the S&P and cash, which is what I’m measuring it against (given its beta to the S&P).
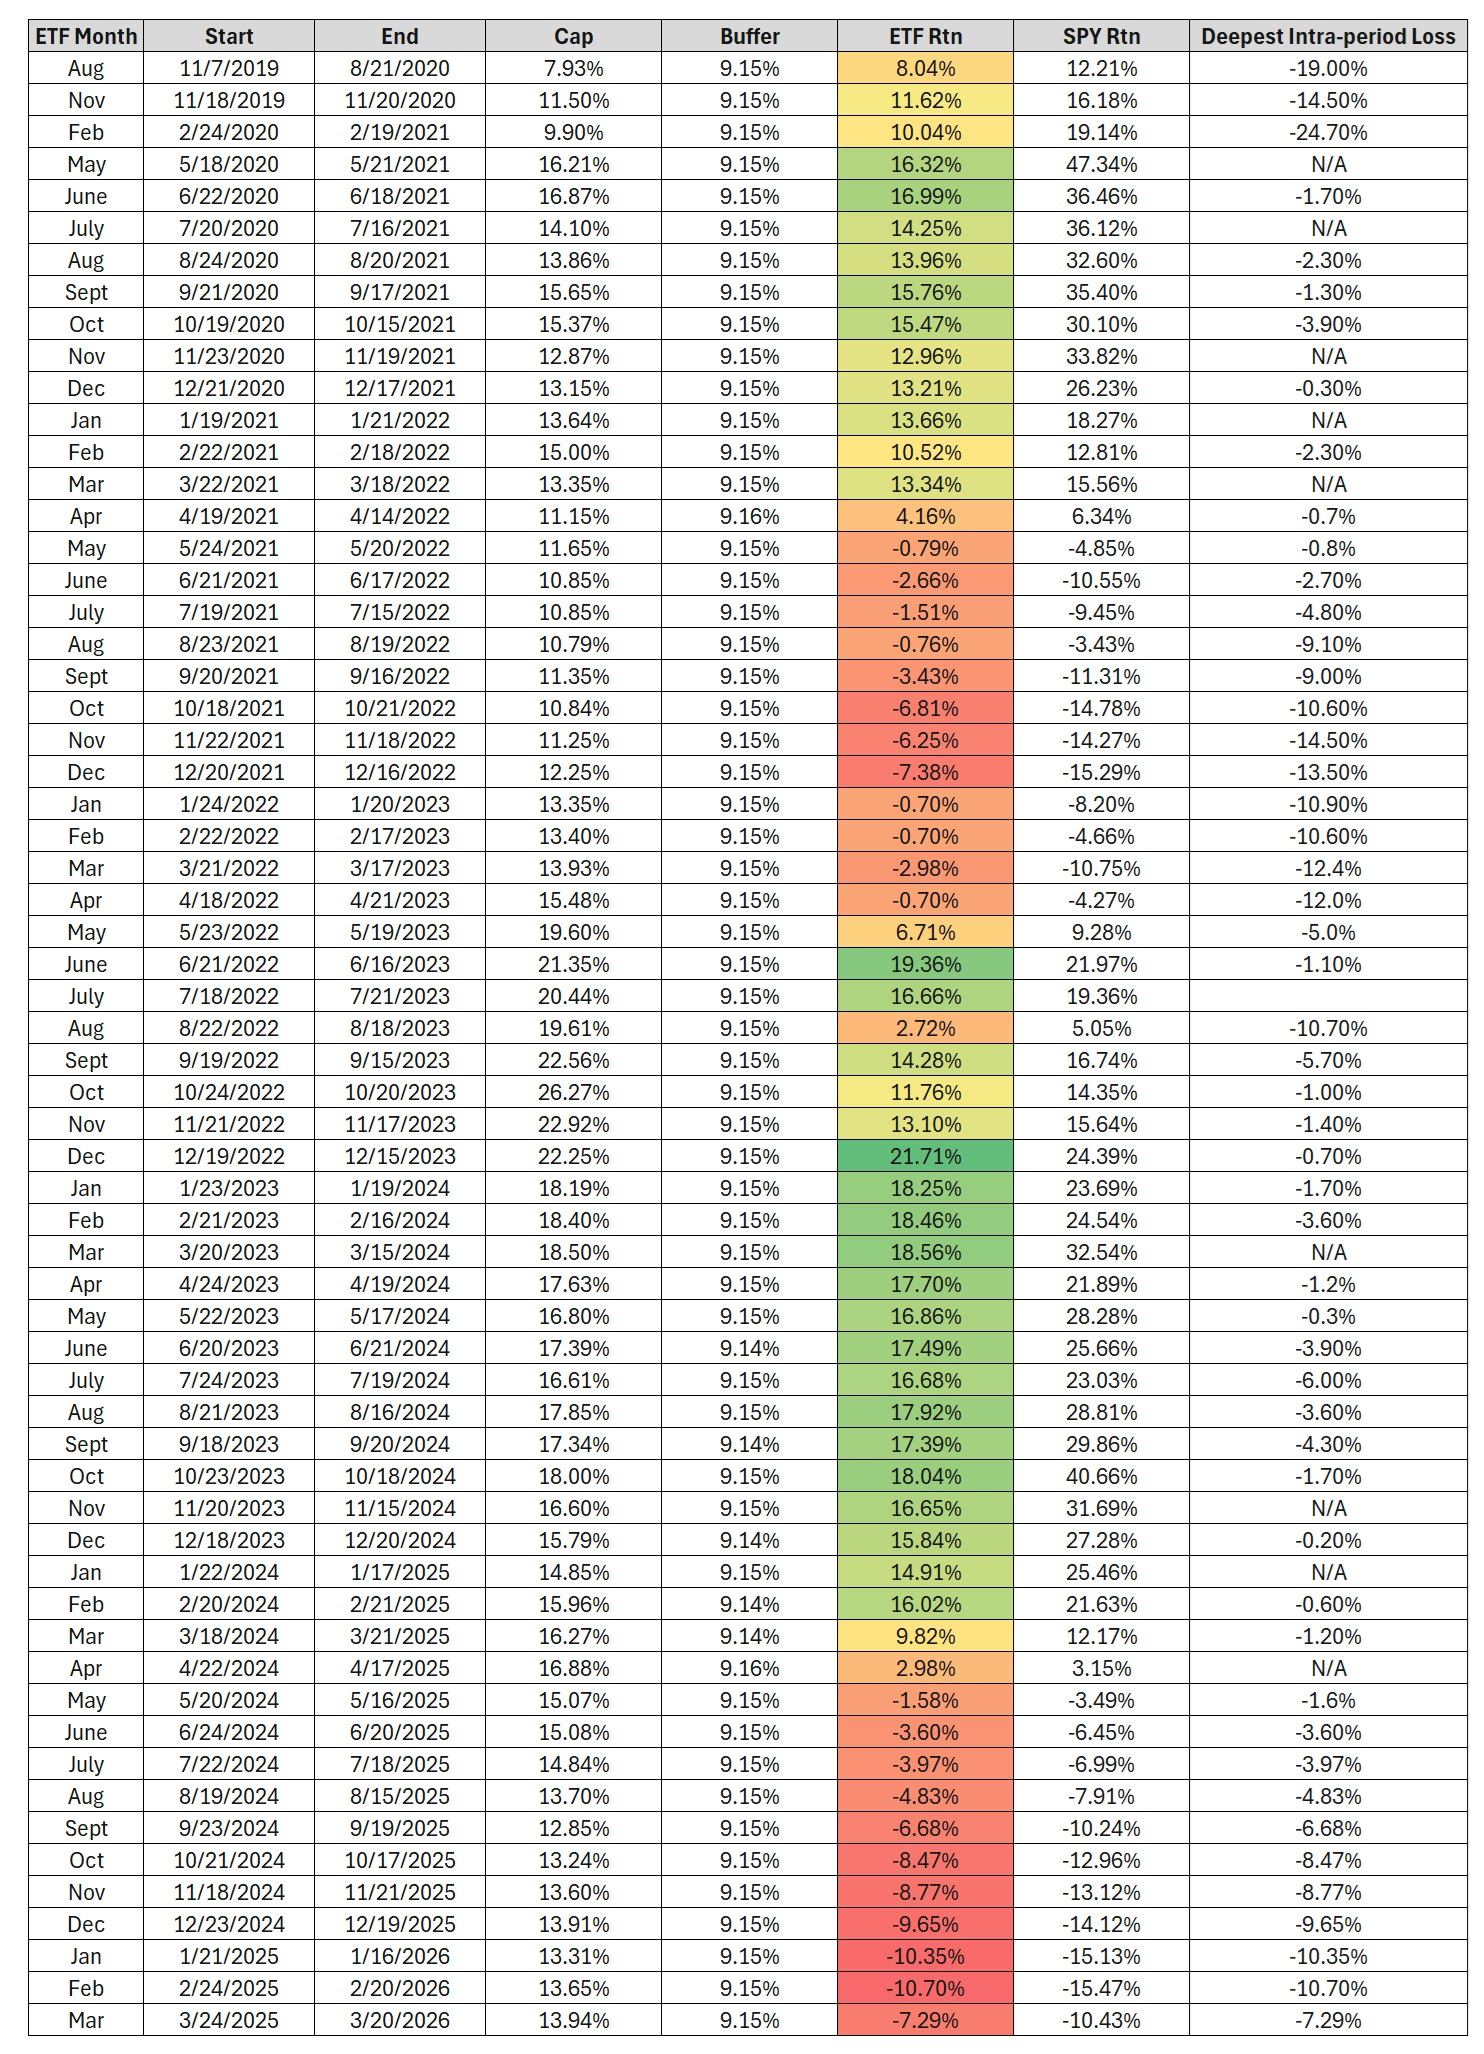
This seems important considering one of the reasons people are drawn to buffer ETFs in the first place is because they arguably obviate the need to form expectations about how asset classes will perform in the future. For instance, in Jan. 2020, an investor considering the Innovator ETF wouldn’t have been asking “will this ETF beat a 71/29% S&P/cash mix in the future?” but rather would be weighing the merits of its terms at the time - i.e., earn up to 13.28% (if S&P rose 14.07%+ on price basis from Sept. 1, 2019 to Aug. 31, 2020) while avoiding first 8.21% of its losses (on price basis).
Second, the S&P 500 and Nasdaq 100-focused buffer ETFs held up pretty well versus the traditional portfolio mix to which they’re most often compared—the classic U.S. 60% stocks/40% bonds allocation. True, the average buffer ETF’s 8.1% annual return lagged the 60/40’s 8.5% per year gain, but it was quite a bit less volatile (9.8% average annual standard deviation vs. 12.8% for the 60/40). Moreover, none of the thirty-five buffer ETFs had a deeper drawdown than the 60/40 (average buffer max drawdown was -13.0% vs. -20.9% for the 60/40). Thus, all but six of the buffer ETFs finished with a higher Sharpe Ratio than the 60/40 did (average=0.60 vs. 0.51 for the 60/40).
(Incidentally, seems worth noting that the 60/40 had a beta of around 0.70 versus the S&P 500 over the Jan. 1, 2020 - Jan. 31, 2025 period. If I subjected it to the same test I applied to the buffer ETFs, I find its 8.5% annual return would have lagged the 11.5% per year return generated by the custom 70/30 S&P/cash benchmark’s. It was about as volatile as the benchmark but had a deeper drawdown.)
Third, while I have no quarrel with AQR’s theoretical argument, the buffer ETFs clearly disclose that (to paraphrase) there’s no assurance they’ll deliver a return within the outcome range if the investor doesn’t hold the ETF from the start to the end of the specified outcome period. Based on the research I’ve done, it appears the ETFs have largely delivered on their promises during those outcome periods.
Also, it looks like investors more-or-less followed instructions, clustering their investments in/around the start of each ETF’s outcome period, thereby earning most of the ETFs’ total returns in the process. I wrote about that here.
I’m not really sure why FT Vest didn’t make some of these points in its own defense. Instead they seemed to lean into the behavioral narrative and tried to swat away AQR’s criticism by arguing that growth in this area is an inevitability. I think that can just feed the perception in some quarters that buffer ETFs are more sizzle than steak, playing on people’s fears and charging a premium for the “certainty” they aspire to offer. Next time, maybe they should run the numbers like AQR did.
Bottom-line: I get why buffer ETFs annoy AQR. They’re not my cup of tea either (I side with AQR’s argument that stocks, bonds, and cash should suffice, more or less, notwithstanding the drubbing traditional allocations took in 2022). But they’ve functioned more or less as designed and investors don’t appear to be mis-using them.
This ended up not being short. Sorry about that. :(
The views and opinions expressed in this blog post are those of Jeffrey Ptak and do not necessarily reflect those of Morningstar Research Services or its affiliates.
Hi Jeff
For a person with significant amount of cash, would buffer ETFs be useful for safely deploying that cash during the current market correction?
Thanks, Michael
Jeff, when you compared the performance of Nasdaq buffer ETFs to a 60/40, what was the “60”? Did you use the Nasdaq index as the 60% stocks?