Another Quick Post on Buffer ETFs
Digging into FT Vest Laddered Buffer ETF (BUFR)

A reporter had asked me how the FT Vest Laddered Buffer ETF (BUFR) has held up amid the market tumult. That ETF, as I explained, is a creature of the twelve underlying month-specific FT Vest buffer ETFs it holds. Those ETFs are FT Vest U.S. Equity Buffer January (FJAN), FT Vest U.S. Equity Buffer February (FFEB), and so forth through the December buffer (FDEC). You can find more data on BUFR’s portfolio here.
Given this, you have to look at how those month-specific ETF did to assess why BUFR has fared as it has. So that’s what I did. Here’s what it looks like for each ETF over its various outcome periods.
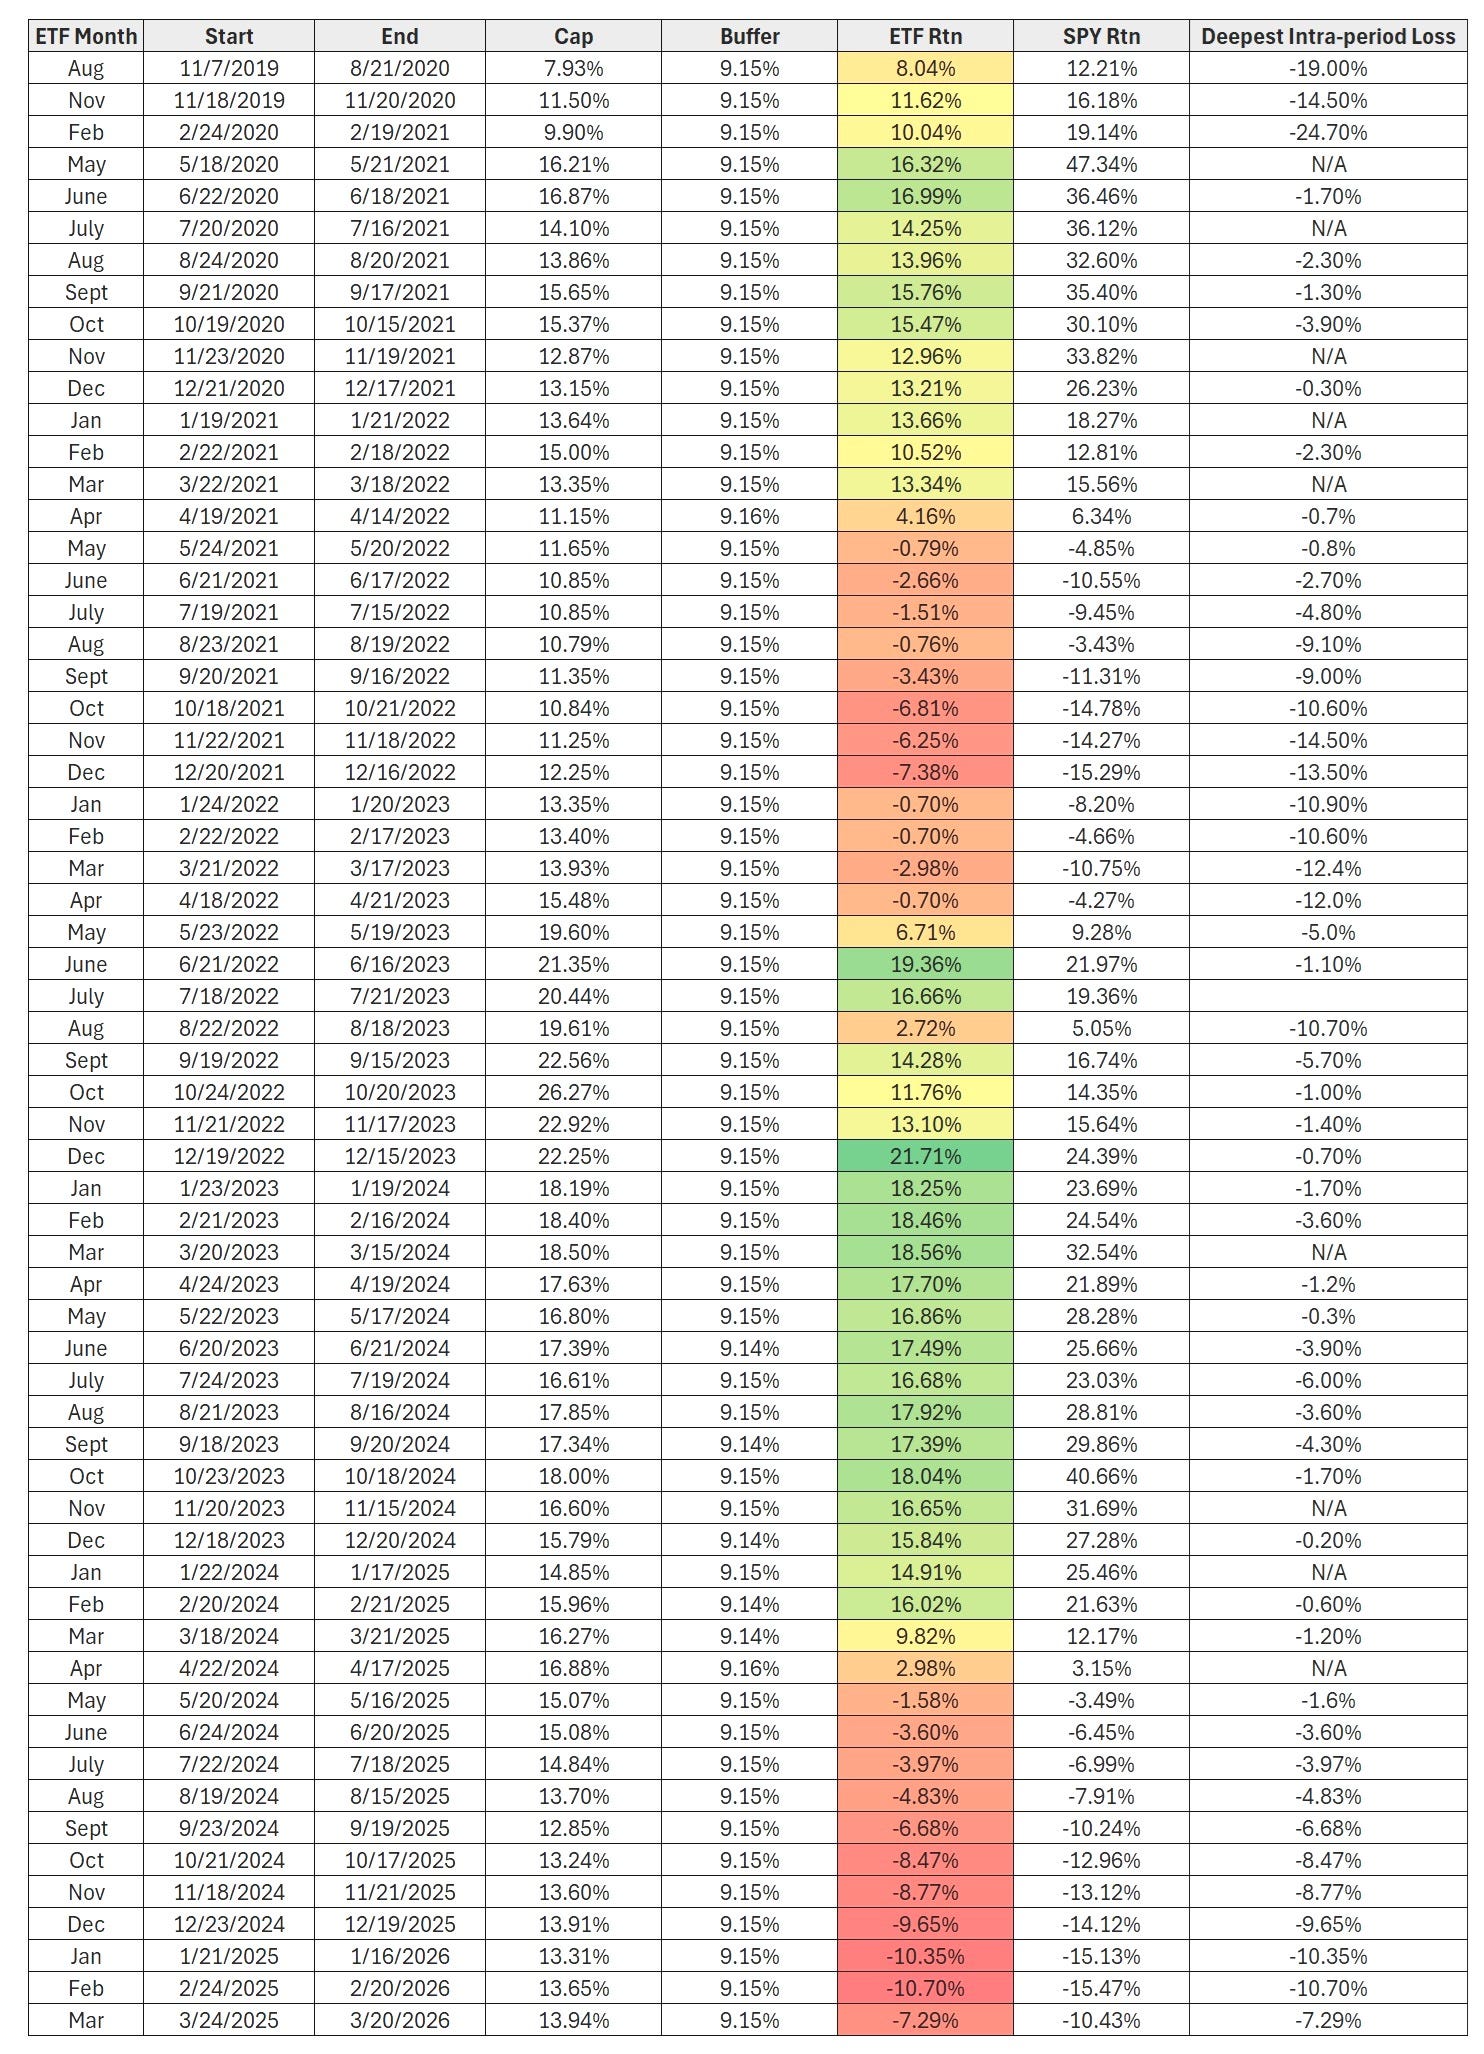
All told, these ETFs appear to have functioned largely as designed. No, they didn’t entirely evade losses but that’s not what they’re built to do. Rather, they are meant to avoid the first 9.15% (net of fees) of losses, but beyond that point they’ll fall tick for tick with SPY.
The other thing you notice—in the rightmost column—is how often these ETFs saw meaningful intra-outcome-period declines. (I measured these as losses relative to the ETF’s starting value, i.e., how much it was worth at the beginning of the outcome period.)
For instance, from Nov. 21, 2021 (the start of the outcome period) to Oct. 15, 2022, the November buffer ETF was down around 14.50%, compared to about -24% for SPY over that span (again, that’s the approximate price-only return). However, that narrowed to a 6.27% loss by the end of the outcome period (Nov. 18, 2022), as SPY rallied into the end of the year and the buffer kicked-in more fully.
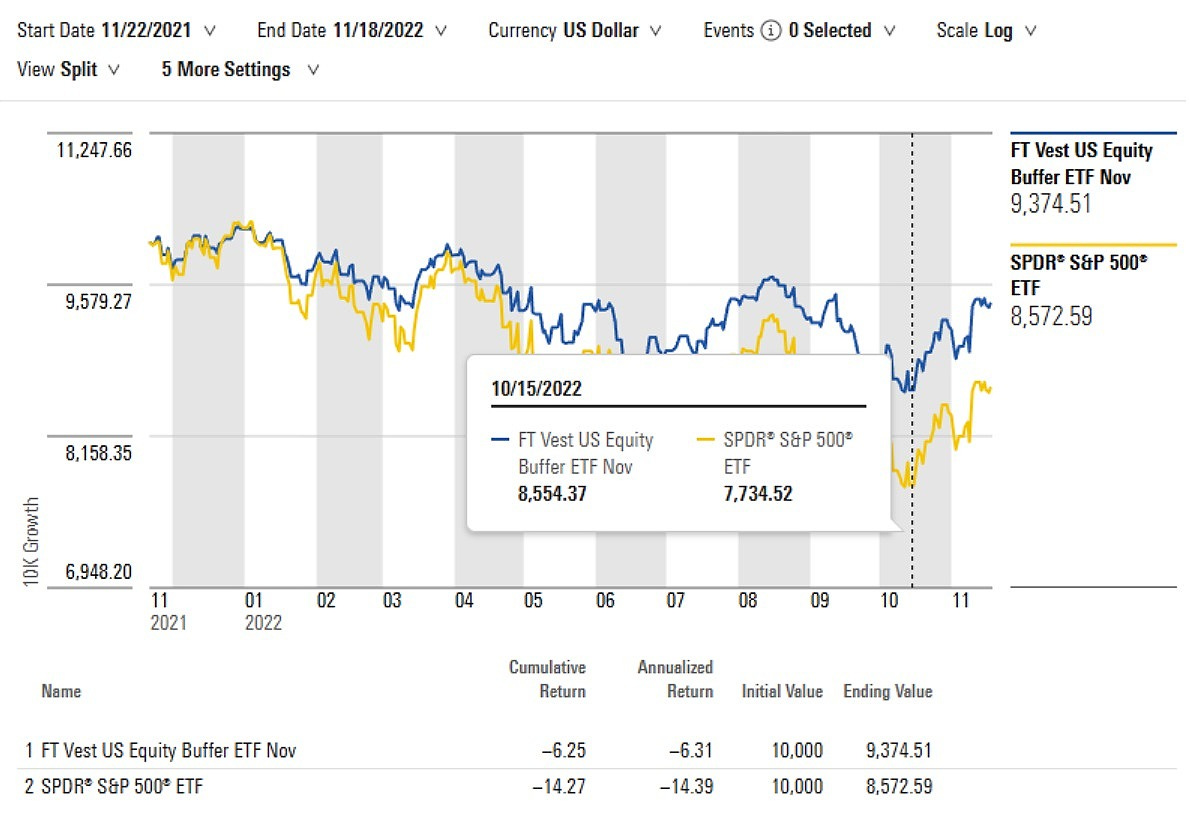
So it’s kind of an object lesson into how important it is to hold on to the end of the outcome period and not be thrown off by intra-period results.
Last thing: How does the laddered buffer ETF’s (BUFR) results compare to that of the underlying ETFs? Here’s what it looks like since BUFR’s Aug. 11, 2020 inception. Note that I’ve thrown in SPY, BND, and the U.S. 60/40 mix (i.e., VBINX) for comparison’s sake. The data this time is through yesterday.
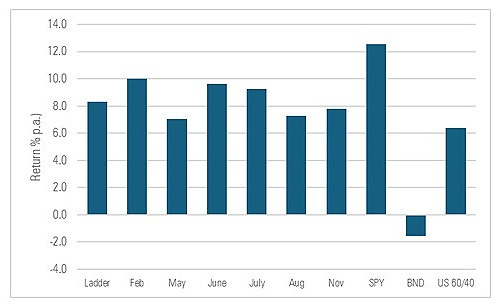
The laddered ETF’s return approximates the average return of the six month-specific buffer ETFs that existed at the time it launched originally (it spread its asset among four month-specific buffers from inception through May 31, 2021 and then all twelve thereafter). Not surprisingly, it falls shy of SPY’s return over this period (total return shown; price-only return will be a point or two less than shown) but surpasses the U.S. 60/40 portfolio’s showing.
These ETFs aren’t my cup of tea—too costly and complicated—but they appear to be functioning largely as designed, even through duress. And the laddered ETF’s performance is comparable to that of its underlying holdings, as you’d expect. Fwiw.
The views and opinions expressed in this blog post are those of Jeffrey Ptak and do not necessarily reflect those of Morningstar Research Services or its affiliates.
Interesting post. Glad I found it. Showed in my LinkedIn feed. You should post about all the anonymous Substack investment newsletter writers who render stock picking advice. Drives me crazy. Haha.