Buffer ETFs: They've Worked but Timing Matters
The five largest buffer ETFs have slid amid this pullback. There's a lesson in that.

I’ve got an article up on Morningstar.com that examines how investors have fared in buffer ETFs in recent years. Long story short, it appears they’ve done well, though there is some start/end-date dependency. Check it out if you’re interested.
That study ran through Feb. 28, 2025 and so would capture some of the recent market volatility but not the carnage of recent weeks. Given that, I thought I’d use this post to tack onto my article that went up on our site today.
Essentially, I was interested in how the five largest buffer ETFs by net assets did from Feb. 19, 2025 through April 4, 2025. Before I break them down one-by-one, here’s a quick summary of the ETFs’ total returns over that span.
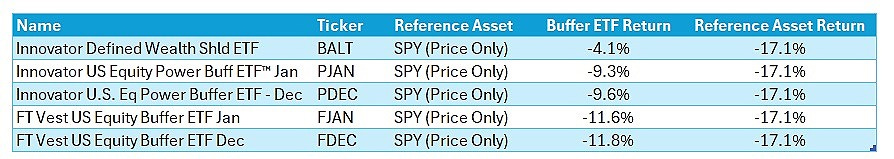
All five ETFs lost less than the S&P did, though the outperformance varied (for reasons I’ll explain in a bit). In case you’re wondering, the U.S. 60/40 allocation lost about 9.9% over this period of time, which means three of the five ETFs did better than that mix.
People might look at this and say “ok not bad but what’s up with the losses?”. That’s where we have to look at each ETF individually, as the results turn on their particular terms, including when the outcome period falls, the magnitude of the return cap and the buffer, where the ETF sat within the outcome corridor, and of course how SPY did over this span.
Innovator Defined Wealth Shield ETF (BALT)
This ETF is different from the others in that 1) its outcome period is only three-months long (versus twelve for the others), 2) its returns are capped at a low level (2.29% whereas most of the others cap somewhere in the teens), and 3) it buffers against the first 19% or so of SPY’s losses (the others buffer only the first 9% or so). With this ETF, you get more frequent resets of the outcome terms and more downside protection, but you’re giving up some of the potential upside due to the lower cap.
Here is what the payoff chart for this ETF looks like by the way:
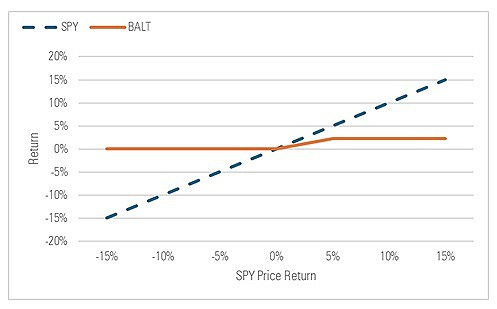
Given the buffer, it might seem odd the ETF lost 4.1% from Feb. 19 through Apr. 4. But the buffer is set with respect to SPY’s value at the start of the outcome period concerned. Since this ETF’s outcome periods are calendar quarterly, it means when SPY began its selloff on Feb. 19, the ETF was in the midst of its prior outcome period, which ran from Jan. 1 through Mar. 31. So the buffer for that outcome period (against the first 19.82% of SPY losses) was with respect to SPY’s value on Jan. 1.
SPY gained 4.6% from Jan. 1 to Feb. 19 and the ETF rose 1.4%. As such, as of Feb. 19, SPY was well above where the buffer kicks in (i.e., its level as of Jan. 1) and thus as SPY began its fall from that level (which I’ve encircled below), the ETF slid with it, losing around 1.5% from Feb. 19 through Mar. 31.
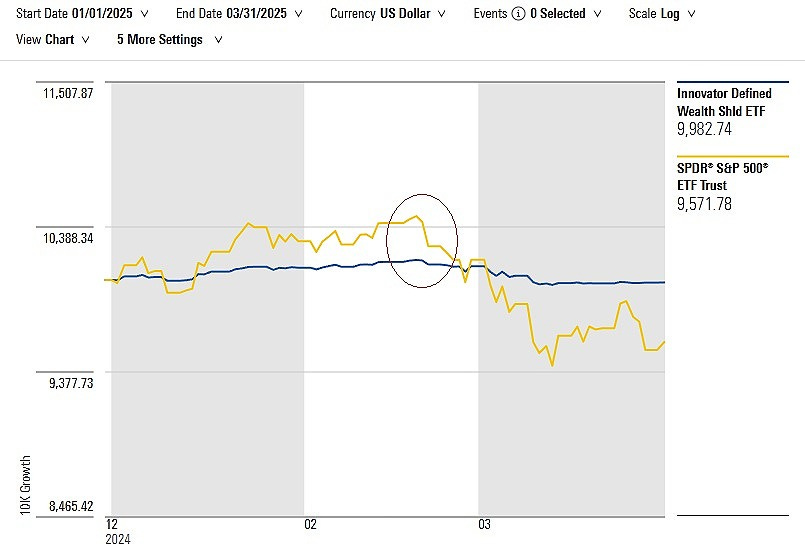
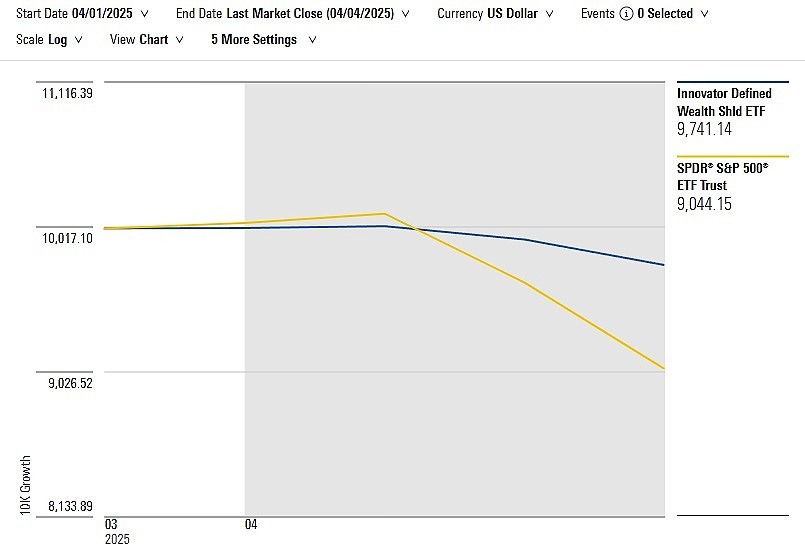
On April 1, the ETF entered a new outcome period (Apr. 1 to June 30) with its own cap and buffer provisions. SPY was more-or-less flat the first two trading days of April but then plummeted on April 3 and 4, leaving it down 9.6% month-to-date. On paper, the ETF shouldn’t have lost any ground but it actually fell 2.6% over this period, bringing its total drawdown to the aforementioned 4.1%.
This case underscores a few points:
The outcome period is what matters. If you don’t hold these ETFs start-to-finish, you could end up with a point-to-point return that falls well outside the outcome corridor implied by the cap and buffer (this is illustrated by the ETF’s Feb. 19 to Mar. 31 decline).
Intra-outcome-period results will not necessarily conform to the ETF’s terms, as evidenced by the fact the ETF slid 2.6% in April despite the buffer against the first 19% or so of losses and SPY being underwater since the outcome period commenced.
Innovator U.S. Equity Power Buffer ETF - January (PJAN)
This ETF’s terms, and those of the three ETFs that follow, are more typical — the outcome period is twelve months and the outcome range is bracketed by a double-digit cap and a buffer.
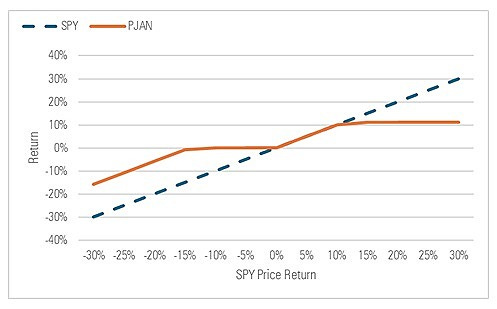
In this ETF’s case, it participates in SPY’s returns up to an 11.24% cap and buffers the first 14.21% of SPY’s losses (relative to its starting value on Jan. 1, 2025). Here is the payoff chart for the ETF, whose outcome period runs from Jan. 1, 2025 through Dec. 31.
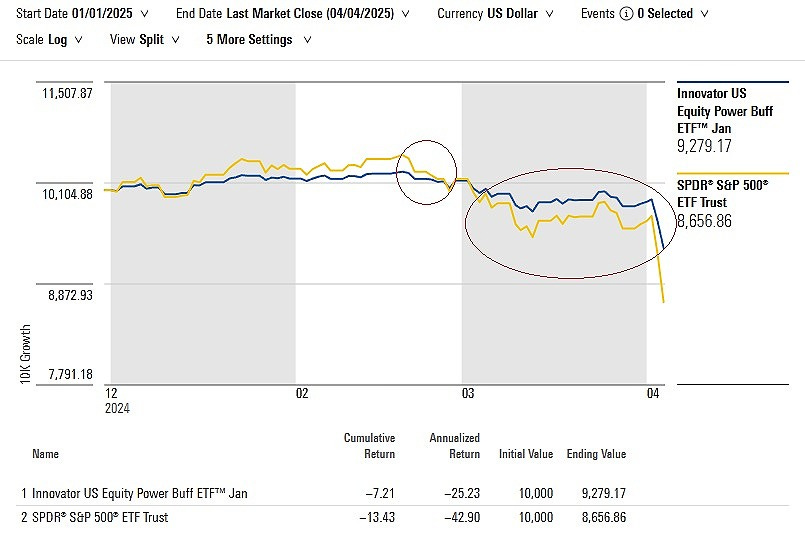
Why has this ETF seen a 9.3% drawdown in recent weeks? SPY gained 4.6% from Jan. 1 through Feb. 19 (the ETF was up about 2.4% over that span). That put SPY above the buffer (which is set with respect to SPY’s value on Jan. 1), exposing it to SPY’s subsequent drawdown, which returned SPY to its Jan. 1 starting value by Mar. 3 (bubble on left). By then, the buffer ETF was basically flat on the year.
What’s been interesting since then, though, is degree to which the ETF has fallen in lockstep with SPY. Since Mar. 2, SPY has declined around 14.7% and the ETF is down 8.3% (bubble on right). Given the buffer, the ETF shouldn’t be down at all, yet this episode highlights buffer ETFs’ vulnerability to drawdowns over segments of time that fall within an outcome period.
Innovator U.S. Equity Power Buffer ETF - December (PDEC)
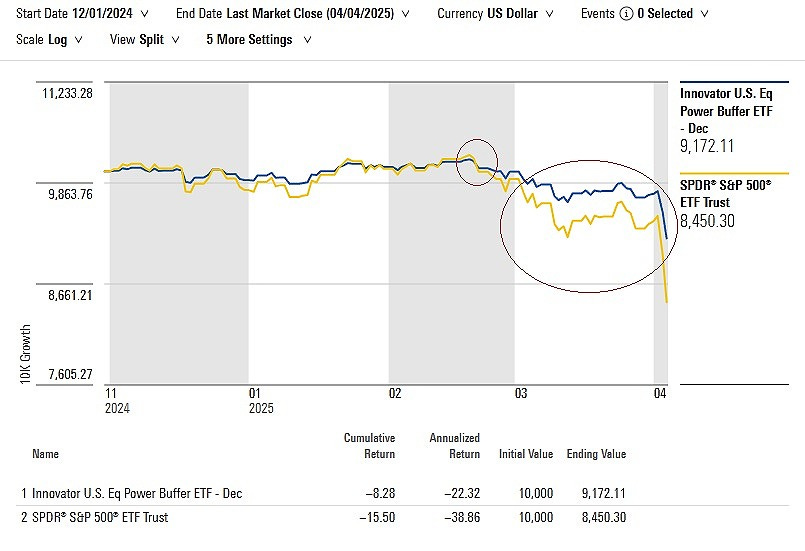
This ETF is essentially the same as the previous one except its outcome period runs from Dec. 1, 2024 through Nov. 30, 2025. As such, the reference points are slightly different, but the story is largely the same.
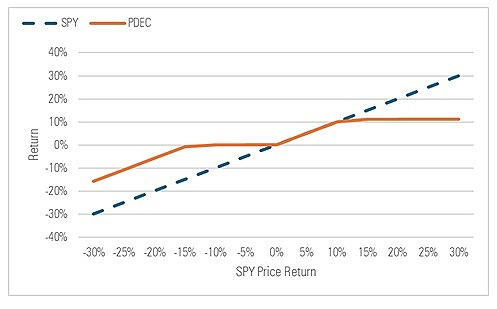
Before we get to why this buffer ETF fell 9.6% from Feb. 19 through Apr. 4, here is a look at its payoff chart. It’s virtually identical to the one above, as it has a very similar return cap (11.11%) and the same buffer (-14.21%)
As in the previous case, this ETF’s drawdown owes to SPY spurting to a gain earlier in the outcome period and as those gains reversed and SPY returned to its starting (i.e., Dec. 1, 2024) value on Feb. 21, the ETF fell with it (bubble on left). But most of the ETF’s loss appears to have occurred since Feb. 21, with the S&P declining nearly 17% over that span and the ETF losing about 9.5% (bubble on right). Again, this isn’t consistent with the buffer—it should shield the ETF from those losses over the full outcome period—but here we’re talking about a period within the outcome period.
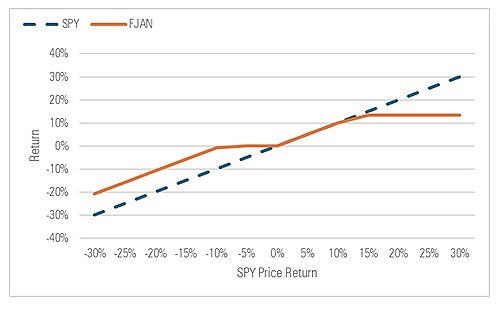
FT Vest U.S. Equity Buffer ETF - January (FJAN)
This ETF is similar to the other January buffer ETF mentioned but the outcome period is slightly different (Jan. 21, 2025 through Jan. 20, 2026) as is the cap (13.31%) and the buffer (-9.15%). Basically, it offers a bit more upside (i.e., higher cap) and is exposed to more downside (i.e., shallower buffer) than the Innovator ETF. Here’s the payoff chart.
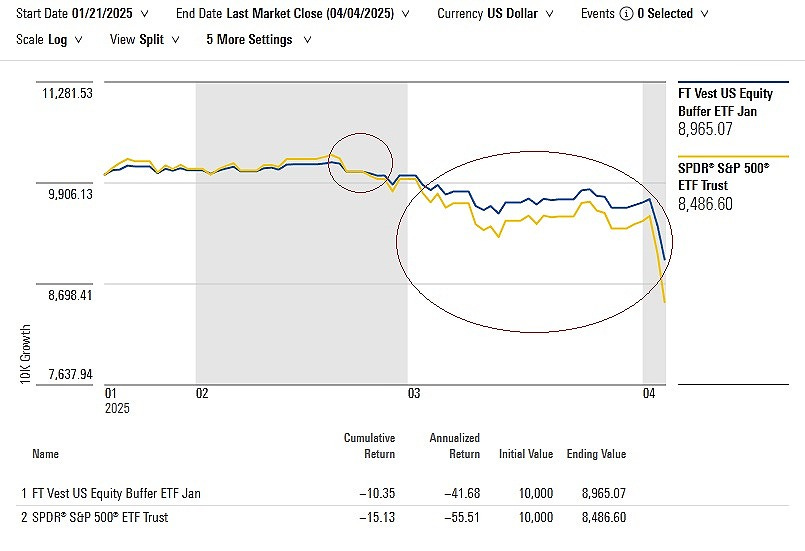
The story here is quite similar to the Innovator January Buffer ETF’s: SPY rose above the buffer protection level from Jan. 21 to Feb. 19, lifting the ETF part of the way with it. But when SPY began to fall on Feb. 19 the ETF drifted lower too, falling about 1.3% until Feb. 2024 when SPY returned to its starting (i.e., Jan. 21) value (bubble on left). But it has kept sliding since then, losing 10.7% amid SPY’s 15.5% decline from Feb. 24 through Apr. 4 (bubble on right). In other words, the buffer hasn’t fully kicked in.
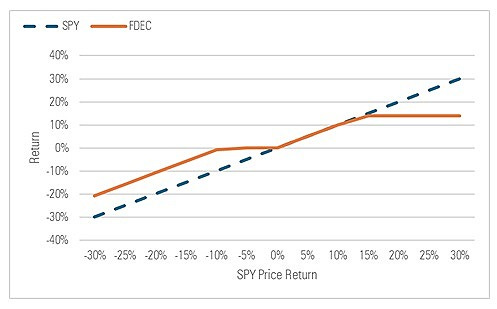
FT Vest U.S. Equity Buffer ETF - December (FDEC)
The last of the five buffer ETFs is similar to the Innovator December ETF but has a slightly different outcome period (Dec. 23, 2024 to Dec. 19, 2025), cap (13.91%), and buffer (9.15%). Here’s its payoff chart.
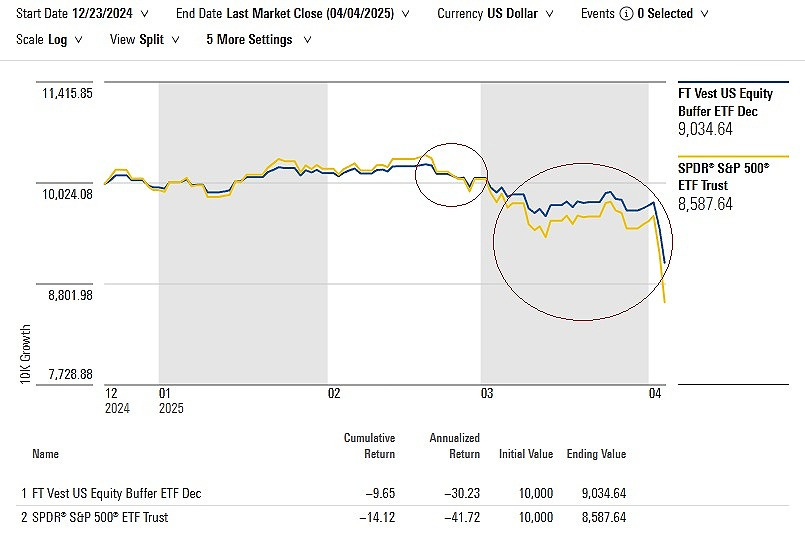
SPY rose from Dec. 23 through Feb. 19, lifting the ETF in the process. That put it above the buffer level and so when SPY fell 2.8% to return to its starting level by around Feb. 26, the ETF lost around 1.6%, too (shown as bubble on left). However, most of the ETF’s drawdown happened after Feb. 26 — SPY fell a further 14.7% and the ETF slid 10.3%, capturing a good chunk of the decline (shown as bubble on right).
The views and opinions expressed in this blog post are those of Jeffrey Ptak and do not necessarily reflect those of Morningstar Research Services or its affiliates.
Jeff, I think the inescapable problem is that it’s too hard to overcome the 200 bps in fees, when you add the expense ratio and the foregone dividends.
So if we are talking about someone with a five-year horizon, would you choose a defined-buffer ETF or a 4% yield (roughly) on Treasurys?