There's a Word for That
One of the more craven things I've seen in the fund industry.

I’ve already written several times about YieldMax.
So I get it if you decide to bail now on this post, which will be the last thing I write here for a while (hopefully forever) about this particular ETF family.
That said, YieldMax’s social-media manager apparently decided Wednesday was a good day to flex about YieldMax MSTR Option Income Strategy’s (MSTY) performance. Here’s the tweet:
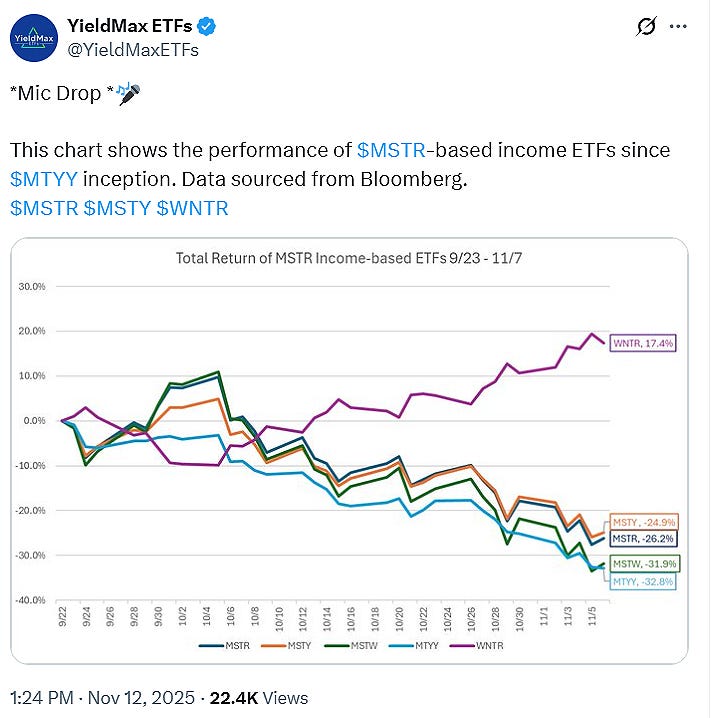
Dunking on two rivals (MSTW and MTYY) because your ETF lost merely a quarter of its value over a month-and-a-half stretch while those competing options fell more is obviously not a great look. Following that tweet with another unironically reminding investors not to fixate on short-term performance took the tone-deafness up a notch.
Look, people say unwise things, myself included. It happens. But the reason I’ve devoted so much attention to YieldMax is because their antics seem to go well beyond questionable judgment or obliviousness, reflecting a degree of cynicism I haven’t often seen in the fund industry. And I’ve seen seen some stuff!
I’ll give a specific example shortly but first let’s pan out to get a sense of how YieldMax ETF investors have fared big picture. To do so, I compiled the ETFs’ reported net income and gains (losses), net flows, and distributions in dollars from their SEC filings (annual reports for fiscal years ended Oct. 31, 2023 and Oct. 31, 2024 as well as semi-annual report for six months ended Apr. 30, 2025) and then estimated those figures for the May 1, 2025 through Nov. 12, 2025 period using available data.
Here’s what it looked like:
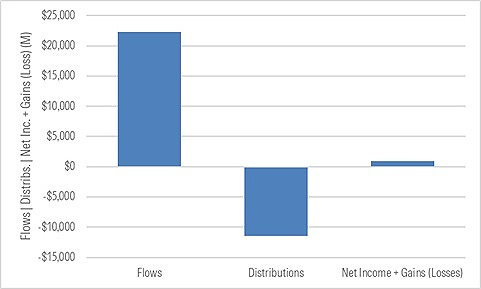
From Nov. 22, 2022, when the first two YieldMax ETFs launched, through Nov. 12, 2025, investors poured a cumulative $22.3 billion into thirty-four YieldMax ETFs based on my estimates*. Those ETFs distributed around $11.4 billion to shareholders. And investors earned about $950 million in aggregate net income and gains.
You read that right: Investors put in $22.3 billion and made less than $1 billion over the nearly three-year period I examined. The distributions were almost entirely capital being shipped back to shareholders. And while these ETFs didn’t earn nothing, consider that over this period the S&P 500 gained more than 20% annually. Even cash earned 4%-plus a year!
Why do YieldMax investors appear to have done so poorly in dollar terms? I’ve already written about it in other posts and articles so here’s the short version:
YieldMax ETFs’ manager, Tidal Financial, elects to create covered-call ETFs on (more often than not) hyper-volatile/story stocks or baskets of such stocks
Tidal declares sky-high distributions to drum-up interest, apparently hoping the ETFs can generate sufficient net income and gains to fund those payouts
The ETFs predictably rattle higher and lower, pushed by streaky performance of the underlying stocks
Investors chase the ETFs’ reported returns and nosebleed-high distribution rates (which they mistake for ‘yield’), often arriving late, after a run-up
Tidal repeatedly returns capital to shareholders, as the ETFs seldom generate enough net income and gains to support the payouts
The chronic return-of-capital short-circuits mean reversion, with assets being pushed out again and again before they have a chance to compound
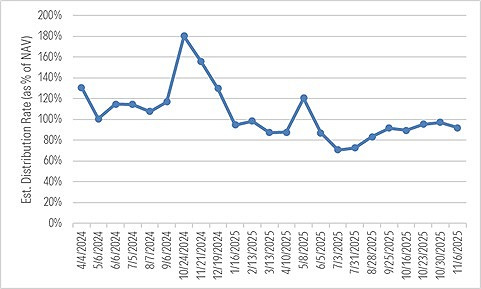
Here’s an example of how this dynamic played out at the ETF mentioned earlier: YieldMax MSTR Option Income Strategy ETF’s distribution rate—the monthly (or weekly) dividend per share multiplied by twelve (52) and then divided by the NAV at the time—has averaged around 100% since its Feb. 2024 inception.
In this chart, I compare the distributions the MSTR ETF paid out in dollars against its estimated net income and gains (losses) between distribution dates**. Broadly speaking, when the latter exceeds the former, then the ETF can fully fund its payouts. But when it doesn’t, the ETF will return capital to plug the shortfall.***
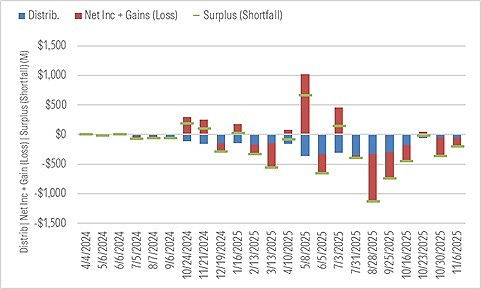
Earlier on, when MSTR was crushing, the ETF was able to support its payouts. But as the stock began to falter, wide gaps opened between the sums it distributed and its net income and gains (losses) between distribution dates. All told, the ETF made around $3.5 billion in distributions from inception through its most recent distribution on Nov. 6, 2025 versus a cumulative $789 million in net losses during that period.
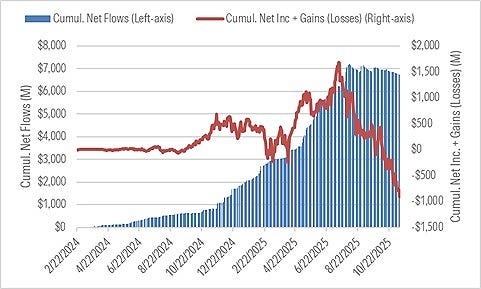
Sustainability of these payouts aside, investors chased the ETF’s returns and massive distribution rates, with lifetime flows peaking right around the time Strategy’s performance began to roll over in July of this year. As a result, I estimate shareholders incurred over $900 million in cumulative losses since the ETF’s inception through Nov. 12, 2025.
And so on and so forth, down the line.
So, in review:
You brand your ETFs “YieldMax”, dictating an extreme yield focus.
You set absurdly high distribution rates that are going to be almost impossible to fully fund but, hey, you’re “YieldMax”.
You seek stocks with very high “implied volatility”, whose options you covet for their plump premiums, which you’re definitely going to need.
You sell on the massive distribution rates you’ve set and the story stocks you’ve chosen.
You induce investors to chase the distribution rates you’re touting, which they mistake for yield, failing to appreciate how reliant the ETFs are on the returns of the unpredictable stocks you chose.
You fail again and again to fully fund the distributions, so return capital to uphold the pretense of having devised portfolios that throws off copious “yield”.
You (or proxies you put forth) suggest the sheer amount of distributions the ETFs have been made is evidence they’ve made good on their name, despite the fact that only a small portion of those payouts was backed by distributable earnings.
You collect tens of millions of dollars in fees.
You watch as a number of the hyper-volatile stocks you’ve chosen get clobbered and the investors who flocked to your products for their yields confront unexpected dollar losses. (Woe to the taxable YieldMax ETF investor, good lord.)
You pooh-pooh shareholder concerns about NAV erosion, shirking responsibility for the humungous distribution rates you elected to set and the rampant return of capital those distribution rates imposed, leading to the very NAV erosion rattling investors (rightly or wrongly).
And then you put out a tweet bragging because one of your ETFs only lost a quarter of its value over a month-and-a-half.
There’s a word for that: Craven.
Endnotes
* YieldMax has more than 34 ETFs. I focused on the 34 that have fiscal year-ends of Oct. 31, 2024. These ETFs have been around the longest and account for the bulk of the assets, with the other ETFs having been incepted more recently. I’ve also excluded two fund-of-funds from these figures to avoid potential double-counting.
** While not all gains are distributable, the net income and gains (losses) I’ve estimated are a conservative, best-case measure of how much could have been available to fund the ETFs’ payouts at the relevant times. The actual distributable earnings was likely less than shown.
*** YieldMax representatives have publicly attributed return of capital to the way portions of its returns are characterized for tax purposes, and to temporary timing differences. My analysis focuses on the ETFs’ fund accounting, specifically the items that reconcile differences between their starting and ending net assets in a given fiscal period. YieldMax/Tidal itself has labeled large portions of its ETFs’ distributions “return of capital” in the annual and semi-annual reports it has filed with the SEC.
The views and opinions expressed in this blog post are those of Jeffrey Ptak and do not necessarily reflect those of Morningstar Research Services or its affiliates.
👀