Smoke and Mirrors
The YieldMax single-stock option income ETFs don't add up

(Note: I made a few labeling errors in the email that went out. I referenced YieldMax NVDA in the first paragraph when it was supposed to be YieldMax TSLA and a little further below referenced YieldMax COIN when I was talking about YieldMax NVDA. That’s 100% my bad. Sorry I missed these before the email went out. It’s fixed below.)
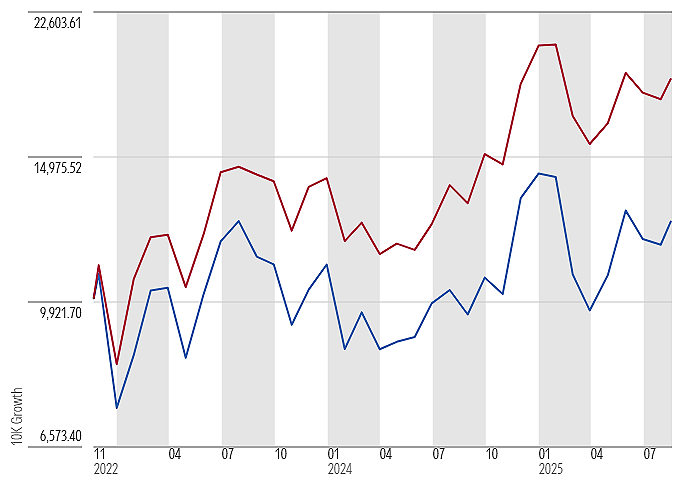
One of these lines shows the growth of $10,000 invested in the YieldMax TSLA Option Income Strategy ETF since its Nov. 22, 2022 inception. The other shows the growth of $10,000 invested in a portfolio consisting of Tesla stock itself (67% weight) and cash (33%), rebalanced monthly. Which is which?
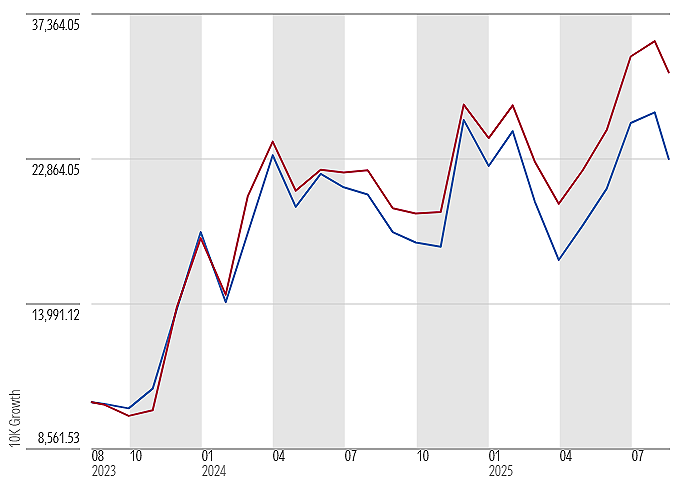
Here’s the same thing for YieldMax COIN Option Income Strategy ETF (since its Aug. 14, 2023 inception) and a 67/33% portfolio split between Coinbase shares and cash. Again, which is which?
How about YieldMax NVDA Option Income Strategy ETF (from its May 10, 2023 inception) and a portfolio split 67/33% between Nvidia shares and cash. Which ya’ pickin’?
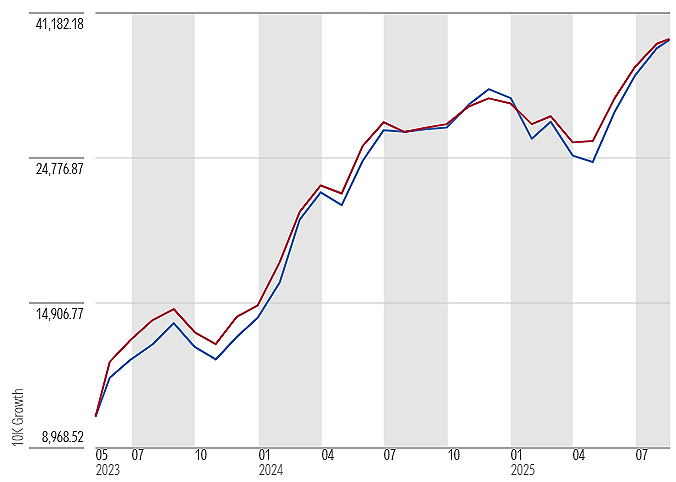
If you guessed that the 67/33 stock+cash portfolio was the red line in each chart…ding-ding-ding, you are correct! In each instance, a simple portfolio split between the reference stock and cash not only beat the corresponding YieldMax ETF, it did so with less volatility.
Were these cases anomalies? They were not. Here is the same thing for every single-stock option-income strategy ETF in YieldMax’s lineup. The returns, standard deviations, and Sharpe Ratios shown are from each ETF’s inception date through Aug. 11, 2025.
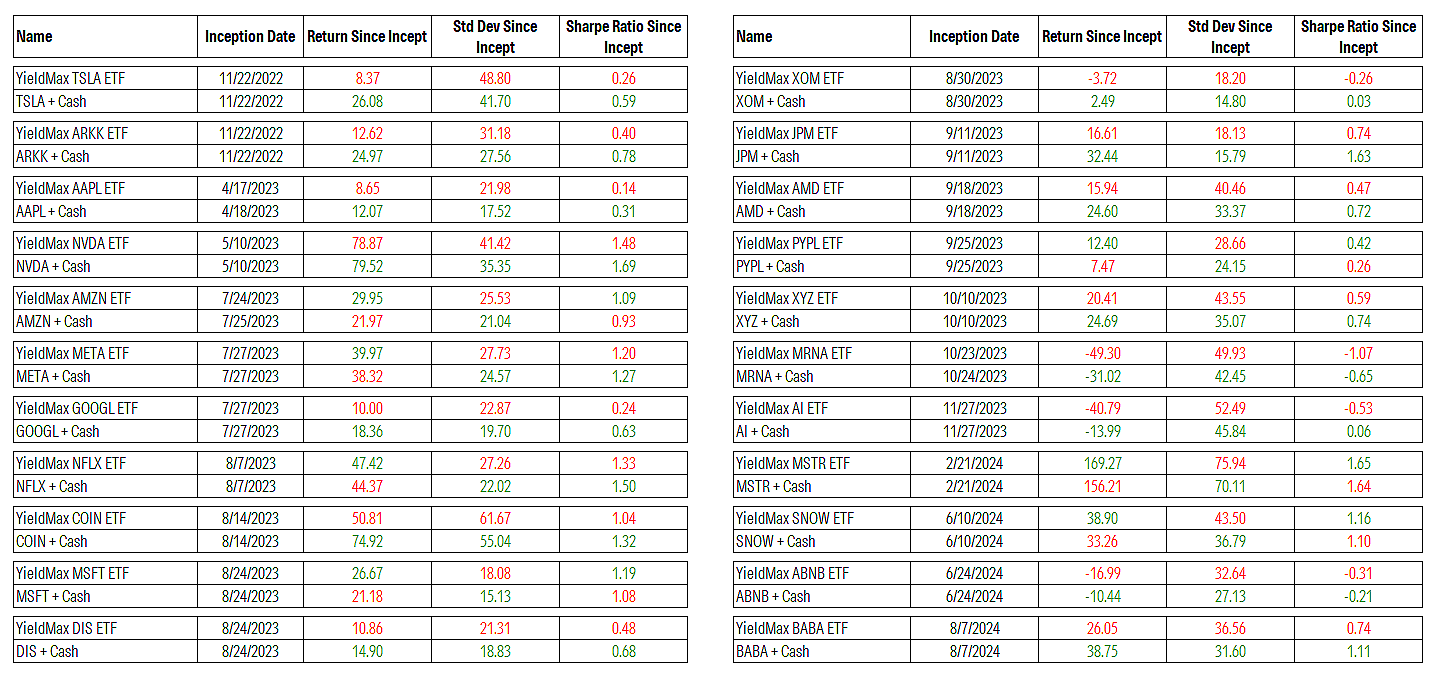
Of the 22 YieldMax single-stock option-income ETFs:
15 would have earned lower returns than the the stock+cash portfolios
22 would have had higher volatility than the stock+cash portfolios
17 would have had lower Sharpe Ratios than the stock+cash portfolios
To bring it all together, I also created a consolidated YieldMax single-stock option-income hypothetical portfolio. It incepted on Nov. 22, 2022, which was the inception date of the first two YieldMax option-income strategy ETFs, which I equal-weighted in that first portfolio. Then I added the other YieldMax option-income strategy ETFs to the portfolio on their inception dates, equally weighting, and so forth.
The “single stock+cash” portfolio mirrored the YieldMax single-stock option portfolio, except instead of holding the YieldMax ETFs it held the “stocks+cash” portfolios that correspond to each YieldMax ETF. For instance, it incepted on Nov. 22, 2022 and equally-weighted the “TSLA+cash” and “AAPL+cash” portfolios, which corresponded respectively to the YieldMax TSLA and YieldMax AAPL ETFs that launched on that date, and so forth for all the subsequent dates.
Here’s how the two compared:
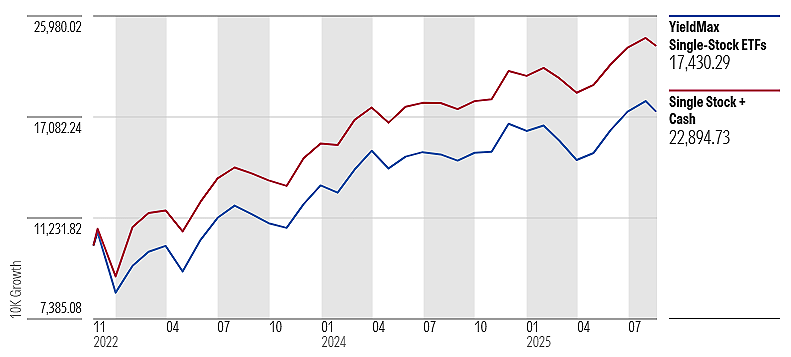
In summary, from Nov. 22, 2022 through Aug. 18, 2025, the “stock+cash” portfolio would have gained 36.2% per year compared to a 23.5% annual return for the YieldMax portfolio. Moreover, the “stock+cash” portfolio was less volatile than the YieldMax portfolio.
You could argue this is all kind of academic if these ETFs are throwing off gobs of income. They’re called “YieldMax”, after all. But as I’ve written previously, the “yield” these ETFs tout appears to be a financial sleight-of-hand. The manager can more-or-less choose the monthly or weekly distribution rate it likes. Then it’s a simple matter of multiplying that rate by twelve and dividing that product by the most recent NAV. Just like that, the ETF has a huge “yield”.
But in most instances the income the ETFs earn from writing options falls far short of what’s needed to fund the distributions. Absent that, the ETFs are reliant on the stock to appreciate in order to plug the gap between the distribution rate the manager has set and the option income it’s collected. And on most occasions they’ve fallen short.
To illustrate, here’s how YieldMax NVDA Option Income Strategy ETF’s total returns compared to its monthly distribution rate (which I measured as the dollar value of the distribution it made divided by its average daily net assets that month).
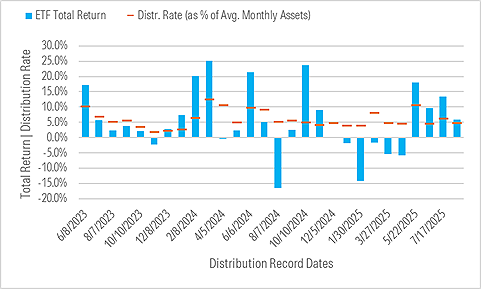
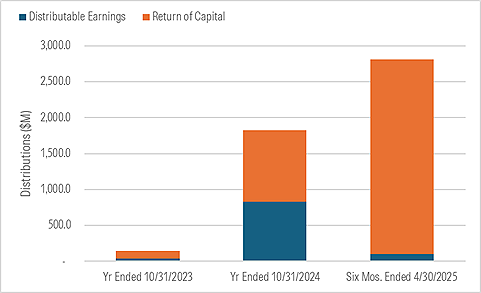
In its fiscal year ended Oct. 31, 2024, the ETF was able to fund most of its distributions from realized gains and options income, i.e, its total returns generally exceeded the monthly distribution rates. But different story in the six months ended Apr. 30, 2025, during which the ETF distributed around $477 million, $454 million of which was return of capital. And why? It skidded to losses in five of the six months, all the while continuing to make hefty distributions.
Or take YieldMax COIN Option Income Strategy ETF. From its Aug. 14, 2023 inception through Apr. 30, 2025, it made distributions of more than $912 million, of which $760 million was return of capital. All told, the YieldMax single-stock option income ETFs collectively distributed around $4.8 billion from Nov. 2022 through Apr. 30, 2025, $3.8 billion of which was return of capital. Meaning only around $0.20 of every dollar they’ve distributed to shareholders has come from earnings.
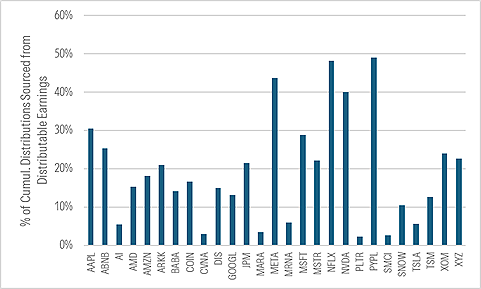
The average YieldMax ETF sourced 19% of its cumulative distributions from distributable earnings and the rest from capital (median was 17%). The YieldMax PYPL Option Income Strategy ETF funded the largest share of its cumulative distributions from distributable earnings (49%) and the YieldMax PLTR Option Income Strategy ETF the smallest share (2%). In dollar terms, the YieldMax TSLA Option Income Strategy ETF returned the most capital: $988 million from its Nov. 2022 incept through Apr. 30, 2025, which represented 94% of all distributions it made.
This isn’t to say that the stocks YieldMax has chosen for these ETFs have done badly. In fact, it’s the opposite. While some like Moderna and C3.ai have been dogs, they were handily offset by mega-winners like Nvidia, Netflix, Coinbase, and especially Strategy. If you built a hypo portfolio holding the stocks the YieldMax single-stock options-income strategy ETFs refer to (adding each on the date the corresponding YieldMax ETF launched), it would have risen around 50% per year from Nov. 22, 2025 through Aug. 18, 2025, smashing the S&P, Nasdaq, and virtually every stockpicker over that span.
So what it really comes down to is this: YieldMax is declaring extremely large distributions for shock and awe. Though a number of the stocks they’ve chosen have done well, it’s been insufficient to fund those distributions. Investors are flocking to these products for the yield, but in reality whatever return the ETFs derive is likely to come mainly from the stock, with a bit of volatility dampening from the option-writing they do. That is, it’s not an *income* story.
The same is true of the proxy portfolios I built that combined the referenced stocks and cash. You could build such a portfolio and declare an unsustainably large “yield”, selling off whatever slice of the portfolio you needed to each month in order to fund it. You’d still be long the stock and you’d still have the cash buffer. Advisable? No. Better than paying 0.99% per year for the same? Yep.
The views and opinions expressed in this blog post are those of Jeffrey Ptak and do not necessarily reflect those of Morningstar Research Services or its affiliates.