What New Sorcery Is This?
An interval fund that seemingly can't lose.

I was going to write a piece about interval funds and how they’ve fared lately. In the process of doing that, I stumbled across a specific interval fund, Redwood Private Real Estate Debt, more-or-less by accident: I couldn’t derive its maximum drawdown over the past year and so in the course of trouble-shooting that I noticed the fund has…never lost money?
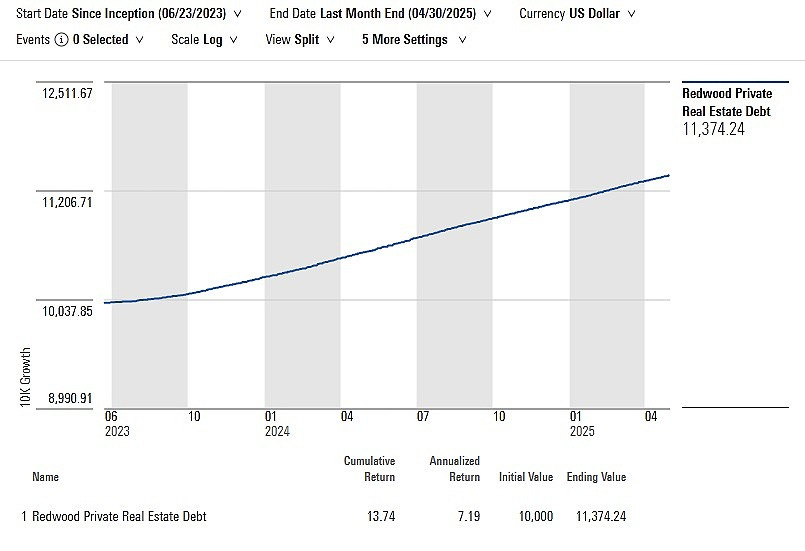
The Redwood fund incepted in June 2023 and in the time since has recorded a loss on just three days by my count—July 28, 2023 (-0.02%), Nov. 29, 2023 (-0.01%), Mar. 28, 2025 (-0.01%). On the other 460 trading days, the fund’s value was either unchanged (181 days) or it notched a gain (279 days).
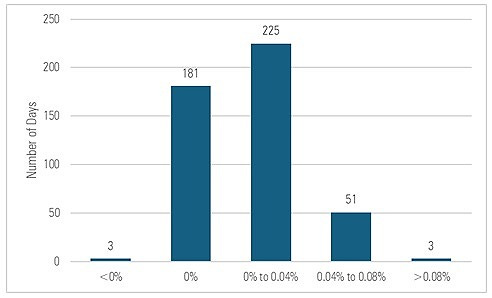
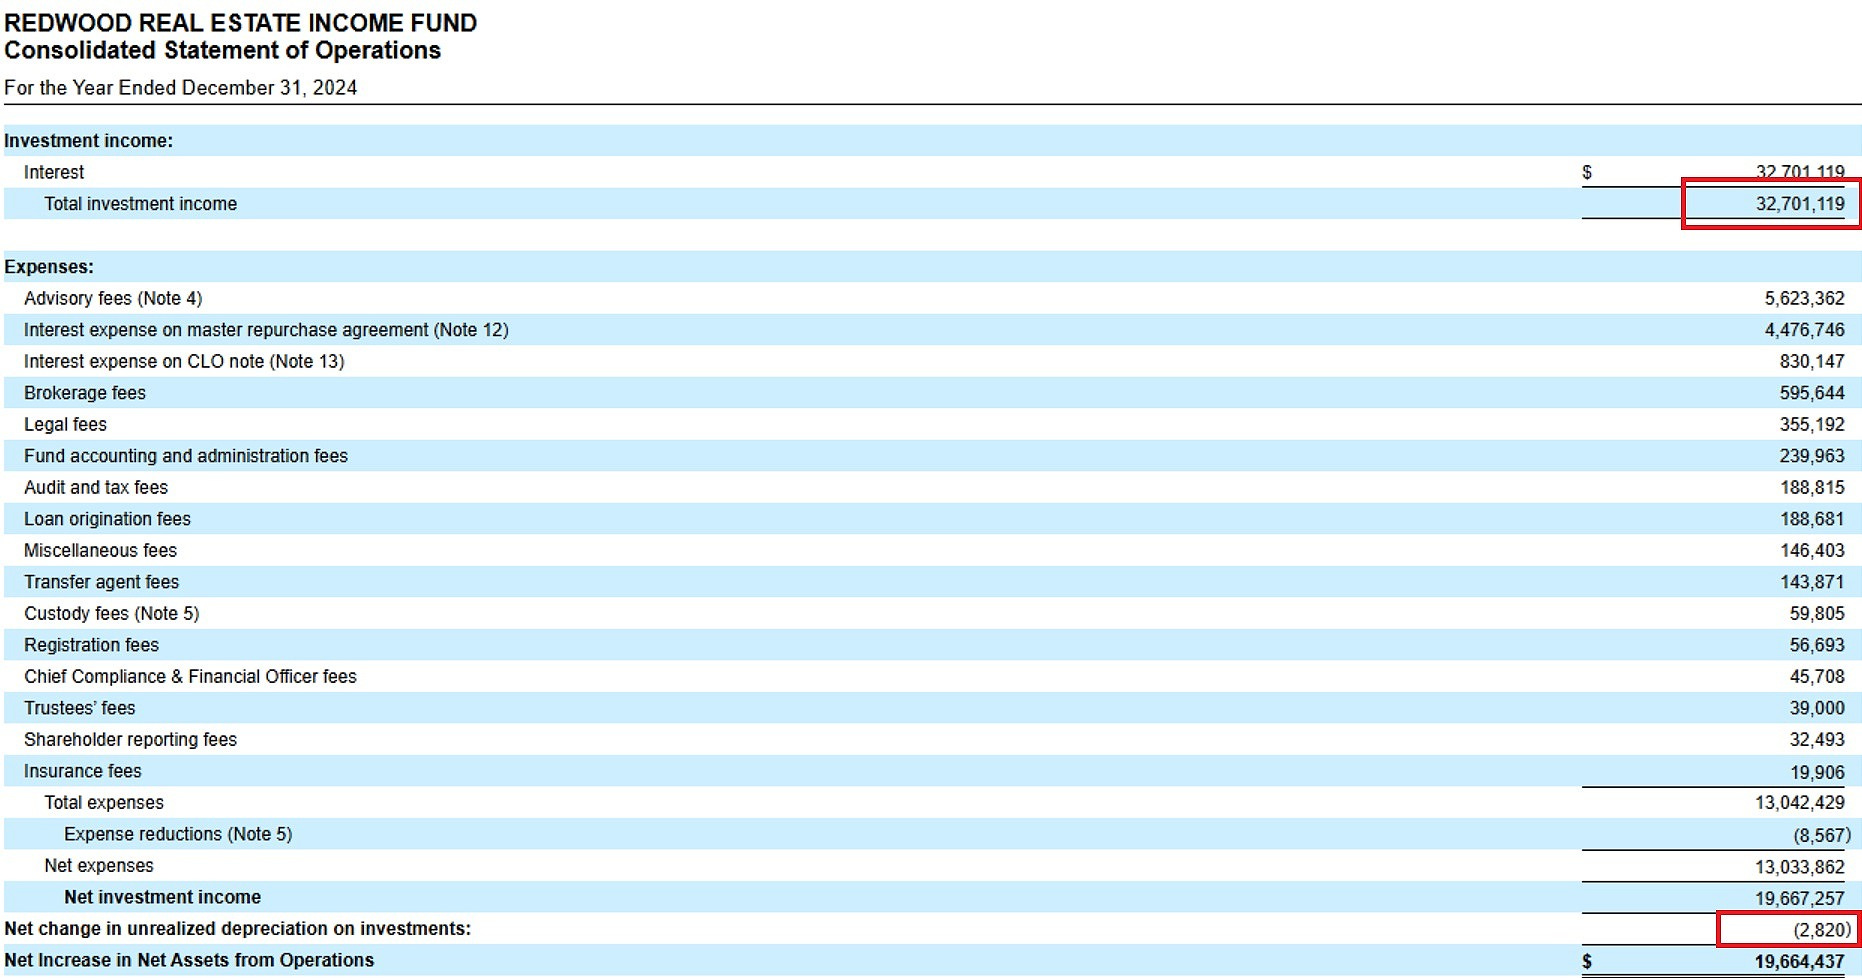
Again and again the fund’s value crept up, typically by four to eight basis points, as it accrued income on its underlying investments—private loans backed by commercial real estate. The fund’s filings seem to corroborate this — in the year ended Dec. 31, 2024 for instance, it collected $32.7 million of interest income and had a piddling $2,820 unrealized loss.
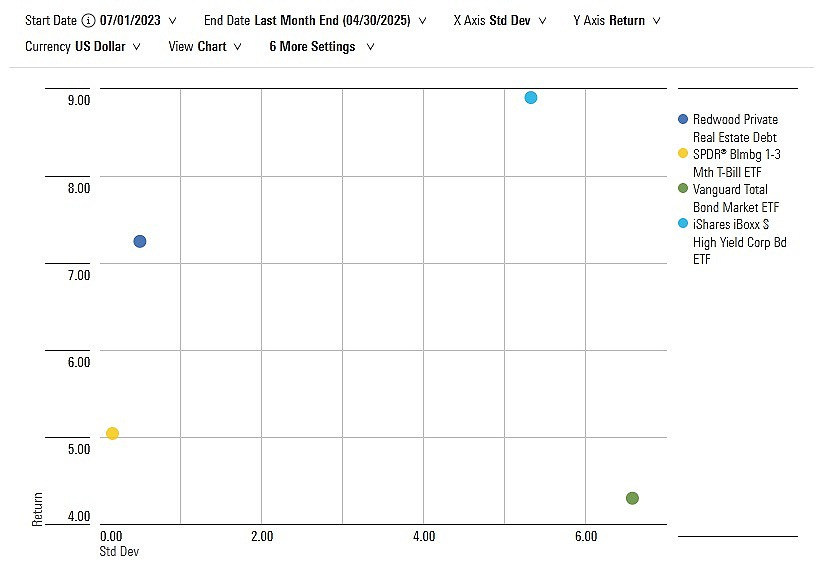
Did I mention the fund has had almost no volatility? From July 1, 2023 through Apr. 30, 2025, it gained 7.2% per year and had a standard deviation of just 0.5%. To put that in perspective, T-bills earned 5.1% per year over that period (with virtually no volatility) while investment-grade bonds gained 4.3% annually but were thirteen times more volatile than the Redwood fund.
Of the more than 10,000 open-end funds and ETFs that existed over this time period, only thirteen had a higher Sharpe Ratio (4.0) than the Redwood fund did. Remarkably, though, there were seven other interval funds that somehow managed to deliver a higher Sharpe Ratio than the Redwood fund did over that span. Of 79 interval funds!
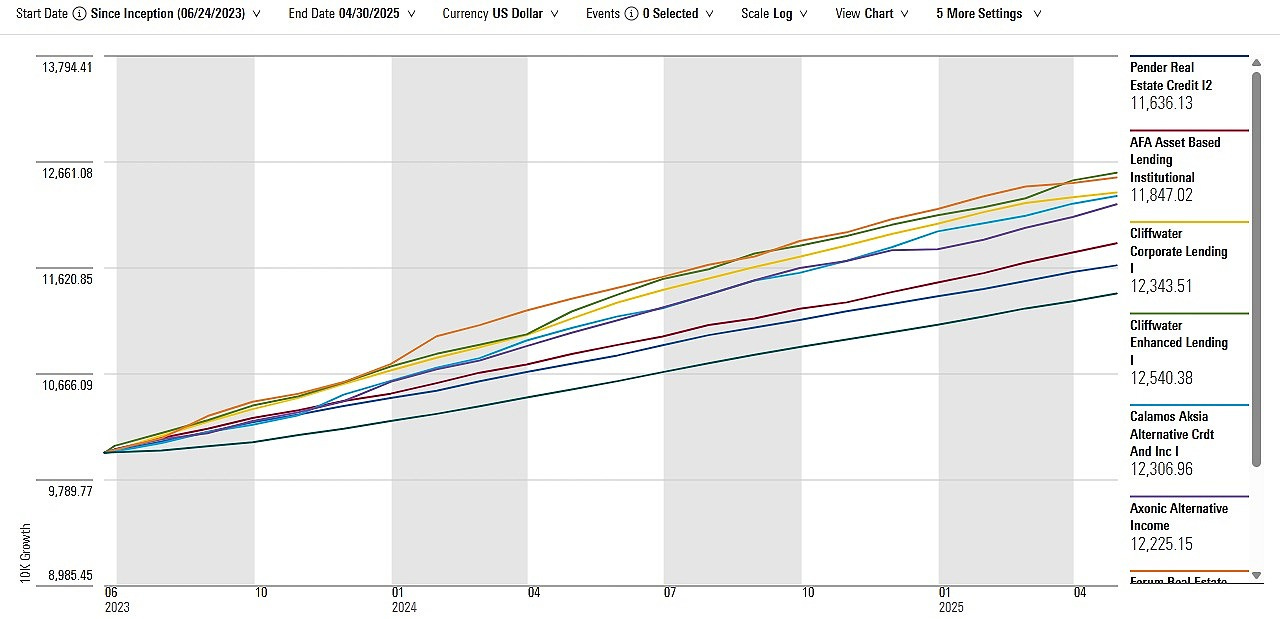
For instance, Pender Real Estate Credit Fund gained about a percentage point more per year than the Redwood fund and, improbably enough, was even less volatile, with a standard deviation of only 0.3%. AFA Asset Based Lending Fund was a touch more volatile than the Pender fund (0.4% per year) but generated an even higher return (9.6% annually), and so forth.
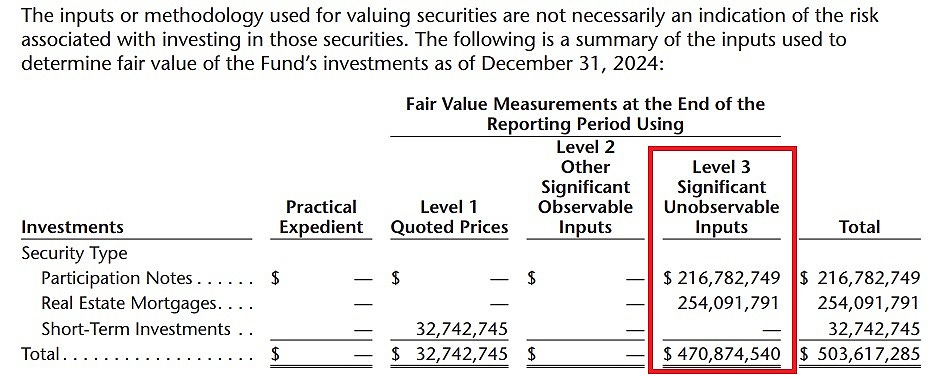
I’m far from an expert on interval funds let alone funds that engage in private lending as these appear to do. But this seems weird at best. By these funds’ own reckoning, they invest in hard-to-value securities (see the screen-cap from the Redwood fund’s annual report below for instance). And yet those holdings virtually never change value? Ever?
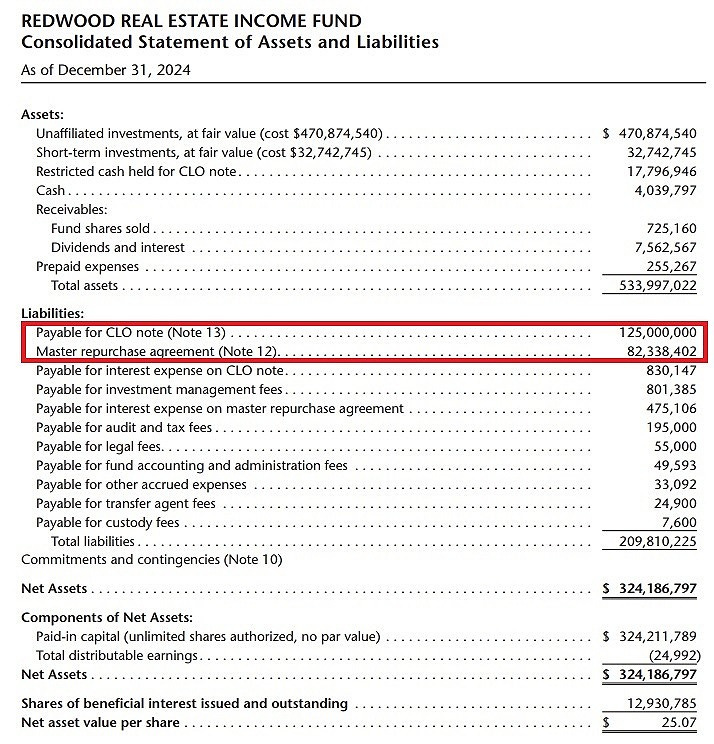
To be fair, time has passed and these funds appear to have successfully managed investors’ redemption requests. But the reported results—a cash-like risk profile coupled with a high-yield-bond-plus return profile—can seem all the more farcical when you consider these funds routinely employ leverage as part of the strategy. For instance, the Redwood fund appears to have utilized a reverse repo and CLO to borrow well over $150 million (net of segregated cash, receivables, and prepaids).
Despite this and the way that leverage would potentially magnify changes in the holdings’ value, the fund has had only three losing days in its lifetime.
What new sorcery is this?
The views and opinions expressed in this blog post are those of Jeffrey Ptak and do not necessarily reflect those of Morningstar Research Services or its affiliates.
privately originated loans don't have cusips - if there isn't a default or material change in the financials of the business, they aren't going to be marked lower. Did you examine their valuation policy in the SAI? Even in private equity the marks don't move much quarter to quarter and many providers rely on practical expedient. There's not much sorcery going on...i'd look to the public markets for some wild valuations
mark to market