

The Less Fund Investors Did, the Better They Did
More trading, more problems.

This will probably be something I turn into a proper article (you can find the stuff I write for my employer, Morningstar, here), but figured I’d share this out now as it’s kind of interesting.
Essentially, I was interested in whether fund investors who traded more did better or worse over time than those who traded less. The problem is that without custodial data, there’s not an easy way to tell how much investors traded. You kind of have to proxy it. So, that’s what I did, choosing the volatility of equity funds’ monthly net flows (as a % of their net assets) over the decade ended Jan. 31, 2025 as my proxy.
I grouped equity funds into quintiles based on their monthly cash-flow vol, from least- to most-volatile. I aggregated their net assets and flows and used that data to estimate their dollar-weighted returns (aka, internal rate of return or “return of the average dollar”) as well as their total returns (aka, time-weighted return or “buy-and-hold return”). Then I compared the two for each grouping.
Here’s what it looked like for the ten years ended Jan. 31, 2025:
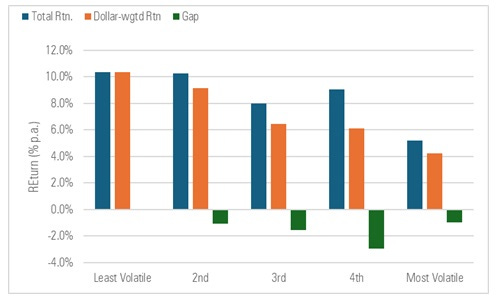
The average dollar invested in stock funds with the most stable cash flows earned more than 10% per year while the average dollar invested in funds with the most volatile cash flows made less than half of that. What’s more, investors in funds with more-stable cash flows captured most of the funds’ aggregate total return while investors in funds with less-stable cash flows captured substantially less of those funds’ time-weighted returns.
In summary, the more buying and selling investors in stock funds did, the worse they tended to do. (And as I’ll cover in the Morningstar article I write, it doesn’t appear it was a function of the volatility of the funds’ returns in each bucket. The average return volatility across the buckets wasn’t that different. More to come.)
Short post, count your blessings. ;)
The views and opinions expressed in this blog post are those of Jeffrey Ptak and do not necessarily reflect those of Morningstar Research Services or its affiliates.
You are absolutely spot on Jeffrey. I discovered this difference between TWR and CWR when I was reading Overlook Richard Lawrence’s book and how he tried to navigate this. Wrote about it here.
https://visioninvesting.substack.com/p/learning-from-richard-lawrence-of
Hi! Thamk you for responding! I’d like to understand the article,
I may not understand the context. I had the understanding that trading more stocks is an active approach while trading less is a passive approach. I am not sure what you are comparing if that is not true.
The story is that you should select ETFs that trade less or even not at all, if I understand correctly. There could be more to it because some active ETFs beat the market.
DYNF ishares factor rotation has a turnover of 90% and is not leveraged FFLC is fidelity fundamental large cap and is not leveraged. My cursory guess is that it invests more in high beta during market up times and more in low beta during down times. It is doing more than that. They both have positive alpha over 3 years or possibly more.
They would not factor significantly into averages but they would be ahead of passive ETFs for a period of time including the last 3 years. Maybe we need something more soohisticated than averages, which does not tell the whole story. It indicates an empirical trend, but may not be conclusive because exceptions like DYNF and FFLC exist.
Thanks for considering this.