Leveraged ETF Investors Scored Gains Last Year. They Probably Also Left Billions on the Table.
A closer look at Direxion's ETFs.
A recent Bloomberg article, “Wall Street’s Levered ETF Boom Is Near-$1 Billion Money Spinner,” reported that a half dozen providers of leveraged ETFs made themselves a boatload of money. $940 million to be exact.
Traders have been diving into leveraged exchange-traded funds, a subset of a derivatives-enhanced products, offering to amp up the daily moves of the world’s most popular stocks and indexes. That’s enriched the firms behind the majority of these ETFs. They netted around $940 million in revenue in 2024, according to Bloomberg Intelligence, which used napkin math to multiply their assets by their fees. That’s a record 37% jump, beating last year’s all-time high.
That piqued my interest so I decided to do a little digging, focusing on one of the six providers, Direxion. Why Direxion? Well, I didn’t have time to pull data for all six and so needed to choose one had a lot of these ETFs and a lot of assets. Hence, Direxion.
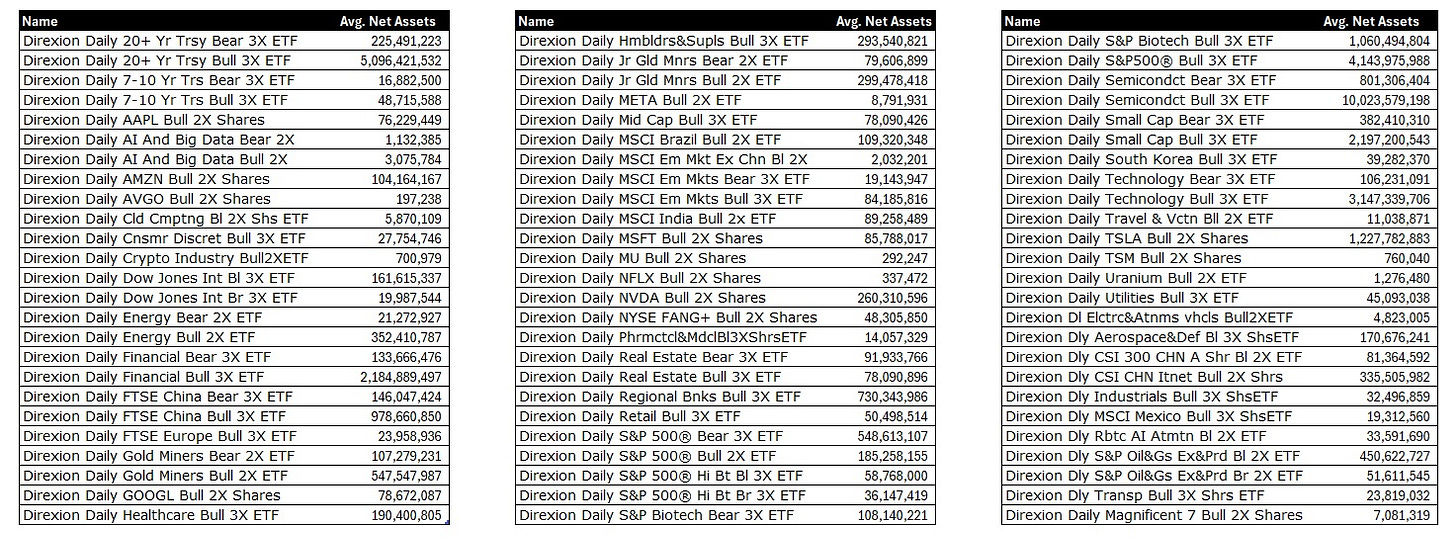
By my count, Direxion offered around 75 leveraged ETFs last year (I defined leveraged as anything that aimed to deliver two or three times the daily return of a reference assets, whether it be long or short). Most are 2x or 3 long and focus on individual stocks and stock indexes.
I was curious how much investors in Direxion ETFs paid in dollar fees and how much money they made (i.e., income plus realized gains (losses) and change in unrealized gains (losses)). So I popped open the ETFs’ annual report for the year ended Oct. 31, 2024 and started adding it all up, using figures reported in the ETFs’ financial statements. Here’s what it looked like.
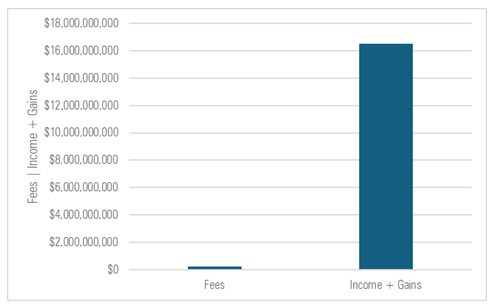
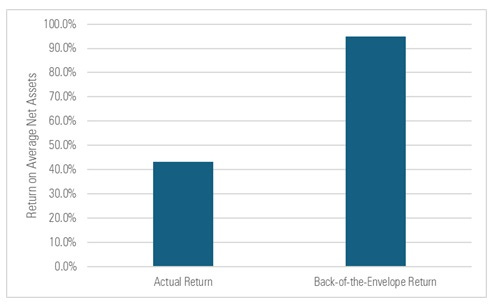
If you’re like me, you look at this and say, sure, they paid a lot in fees (~$250MM of net advisory fees in aggregate) but they also made real money (~$16.5 billion in income and gains). To put those numbers in context, the ETFs held ~$38.3 billion in average net assets that year in all. So it means investors paid 0.65% of average net assets in management fees and earned a ~43% return before fees on those assets. Not bad!
But the thing is investors probably should have made significantly more than 43% on their average net assets. For instance, when I back-of-the envelope multiplied each Direxion ETF’s average net assets for the year ended Oct. 31, 2024 by the reference asset’s leveraged return that year (i.e., Direxion Daily S&P 500 Bull 3x = S&P 500’s 38% return x three = 114%, and so forth), it would have worked out to $36.3 billion in income and gains, equivalent to a nearly 95% return on average net assets.
It’s here that I should mention that the math I’ve just described isn’t correct. Why? Because these ETFs aren’t meant to be held longer than a day yet my back-of-the-envelope math effectively assumed otherwise (i.e., that there was no “decay” stemming from path dependency of returns and Direxion having to square up its position each day). So, to estimate what investors in, say, Direxion Daily S&P 500 Bull 3x ETF could have earned, I shouldn’t have multiplied the S&P’s return by three but rather by a different figure. What figure was that?
As it turns out, the ETF’s manager has provided it: Its model indicated that the Direxion Daily S&P 500 Bull 3x ETF had a 151% expected return over the year ended Oct. 31, 2024.

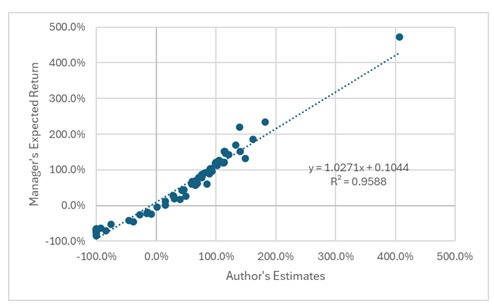
Not only did the manager furnish an expected return for this ETF, it did so for every other Direxion ETF that had a full-year return. As such, I could compare the manager’s expected returns for each ETF against the returns I used in my back-of-the envelope calculation. As it turns out, my estimates weren’t too far off.
Nonetheless, I went ahead and plugged the manager’s expected returns into my calculation, multiplying them by each ETF’s average net assets for the year in the same way I described above. By that measure, the return on average net assets would have exceeded 100%, which was even higher than what I estimated back-of-the-envelope. (See the rightmost column in the chart below.)
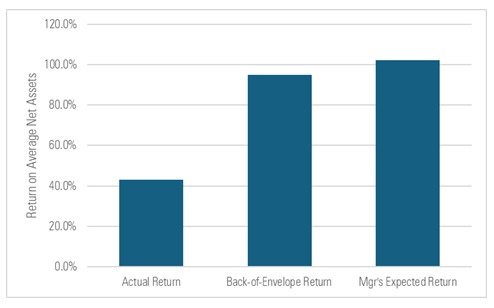
Even if you don’t agree with how I’m estimating the returns shown above, it’s pretty striking to observe the differences between the manager’s estimated expected returns for the individual ETFs. For instance, below I’ve shown the reported total return, manager’s estimated expected return (based on its model), and estimated income/gain as a percentage of net assets (“My Estimate”) for the ten biggest Direxion ETFs based on average net assets during the year ended Oct. 31, 2024.
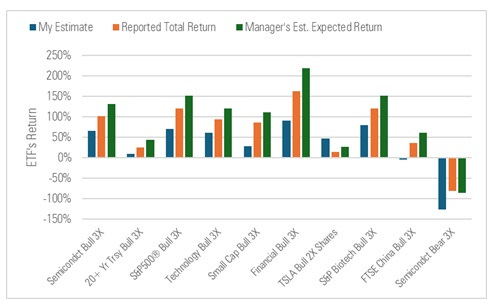
These ten ETFs had an average reported total return of around 68% and an average expected return (per the manager’s estimates) of roughly 93%. So it appears these ETFs lagged the manager’s estimates by a pretty wide margin, even after allowing for some of the differences the manager mentions in its disclosures.
The models do not take into account the expense ratio, or any transaction or trading fees associated with creating or maintaining the Fund’s portfolio. Deviation from the model may be due to a combination of asset fluctuation, expenses, transaction costs, including swap contract related costs and underlying volatility.
But what really stands out is the extent to which investors’ dollar gains (as a percentage of average net assets; “My Estimate”) in these ETFs lagged the ETFs’ reported total returns. For instance, the Direxion Daily Semiconductor Bull 3x ETF notched a 102% total return in the year ended Oct. 31, 2024 but investors earned only $6.6 billion in income and gains on $10 billion in average net assets they’d invested over that span, a 66% return.
What explains that large gap? Some of it could be arithmetic. For instance, the total return figure doesn’t take assets into consideration while my estimate does. But it’s likelier than not that a lot of it stems from mis-timed purchases and sales by investors.
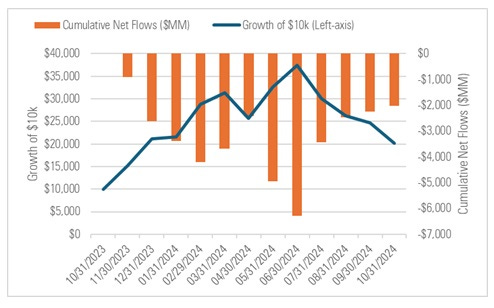
Specifically, it appears the semiconductor ETF saw around $6.3 billion in outflows from Nov. 2023 through June 2024. This despite earning a roughly 274% return over that span. Moreover, investors then added about $4.2 billion of net new money to the ETF from July 2024 through October 2024, only to see the ETF slide to a 46% loss during that period.
Direxion can’t control who invests in its products or when and how they buy and sell them. But when you take everything together — the ETFs’ total returns tending to lag the manager’s own estimates for how well they should have performed and investors seeming not to earn the ETFs’ total returns — you find there’s a big chasm between expectations and results. It should be enough to give anyone pause.
The views and opinions expressed in this blog post are those of Jeffrey Ptak and do not necessarily reflect those of Morningstar Research Services or its affiliates.


These things are horribly tax inefficient too. Except in bear markets when they return capital, eroding principal.
It seems like you should be able to benefit from daily decay by longing puts.