Getting Stronger
Fees appear to have gotten even more predictive.

This will be a short post, as I have a longer article on the topic I expect will run on Morningstar.com in the near future. I’ve been doing some work on the extent to which fund fees are explaining performance differences. It has seemed to me that fees have become even more decisive but I’d never looked at in a concerted way. So, here goes.
Here’s a chart showing the average performance of stock and bond funds that I ranked by expense ratio and assigned to buckets based on those ranks (cheapest 10%; next 22.5%, middle 35%; next 25%, and priciest 10%). The fee ranks were done versus category peers so the buckets should be cross-sectionally consistent, apples-to-apples. This covers the 10 years ended Nov. 30, 2025.
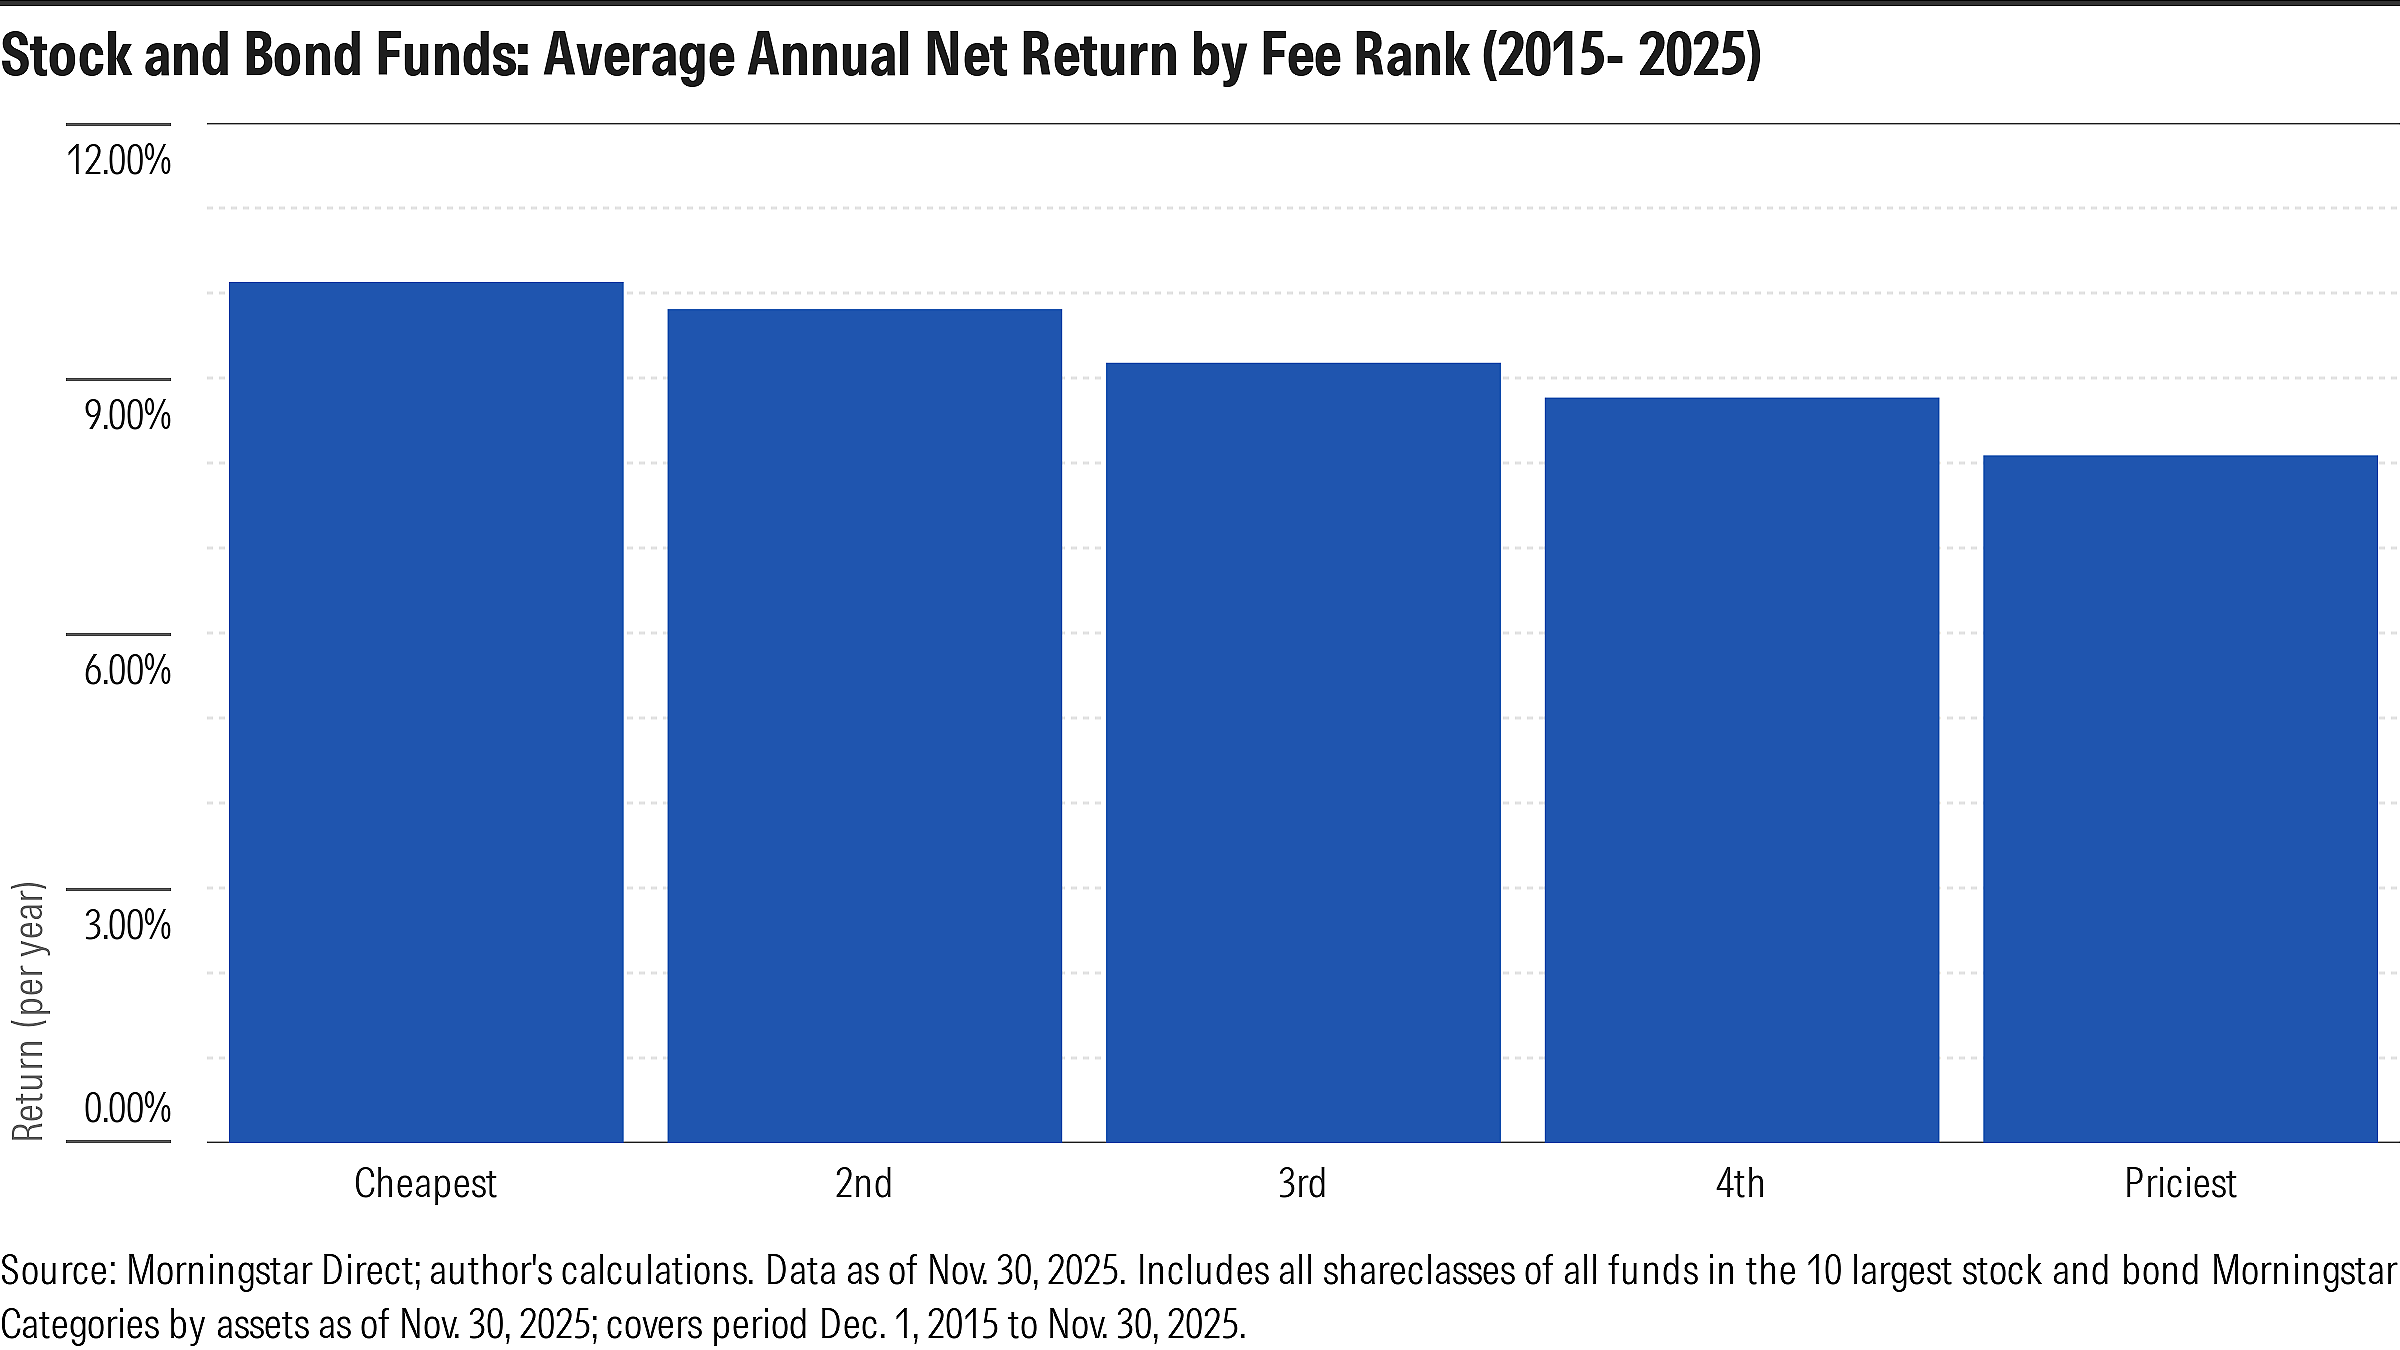
That’s a good sort. Not a big surprise. Lots of work has been done on this, with my colleague Russ Kinnel publishing the landmark study on the topic some years ago. So I’m not breaking any new ground here though this hopefully gives a sense of fees’ predictiveness lately.
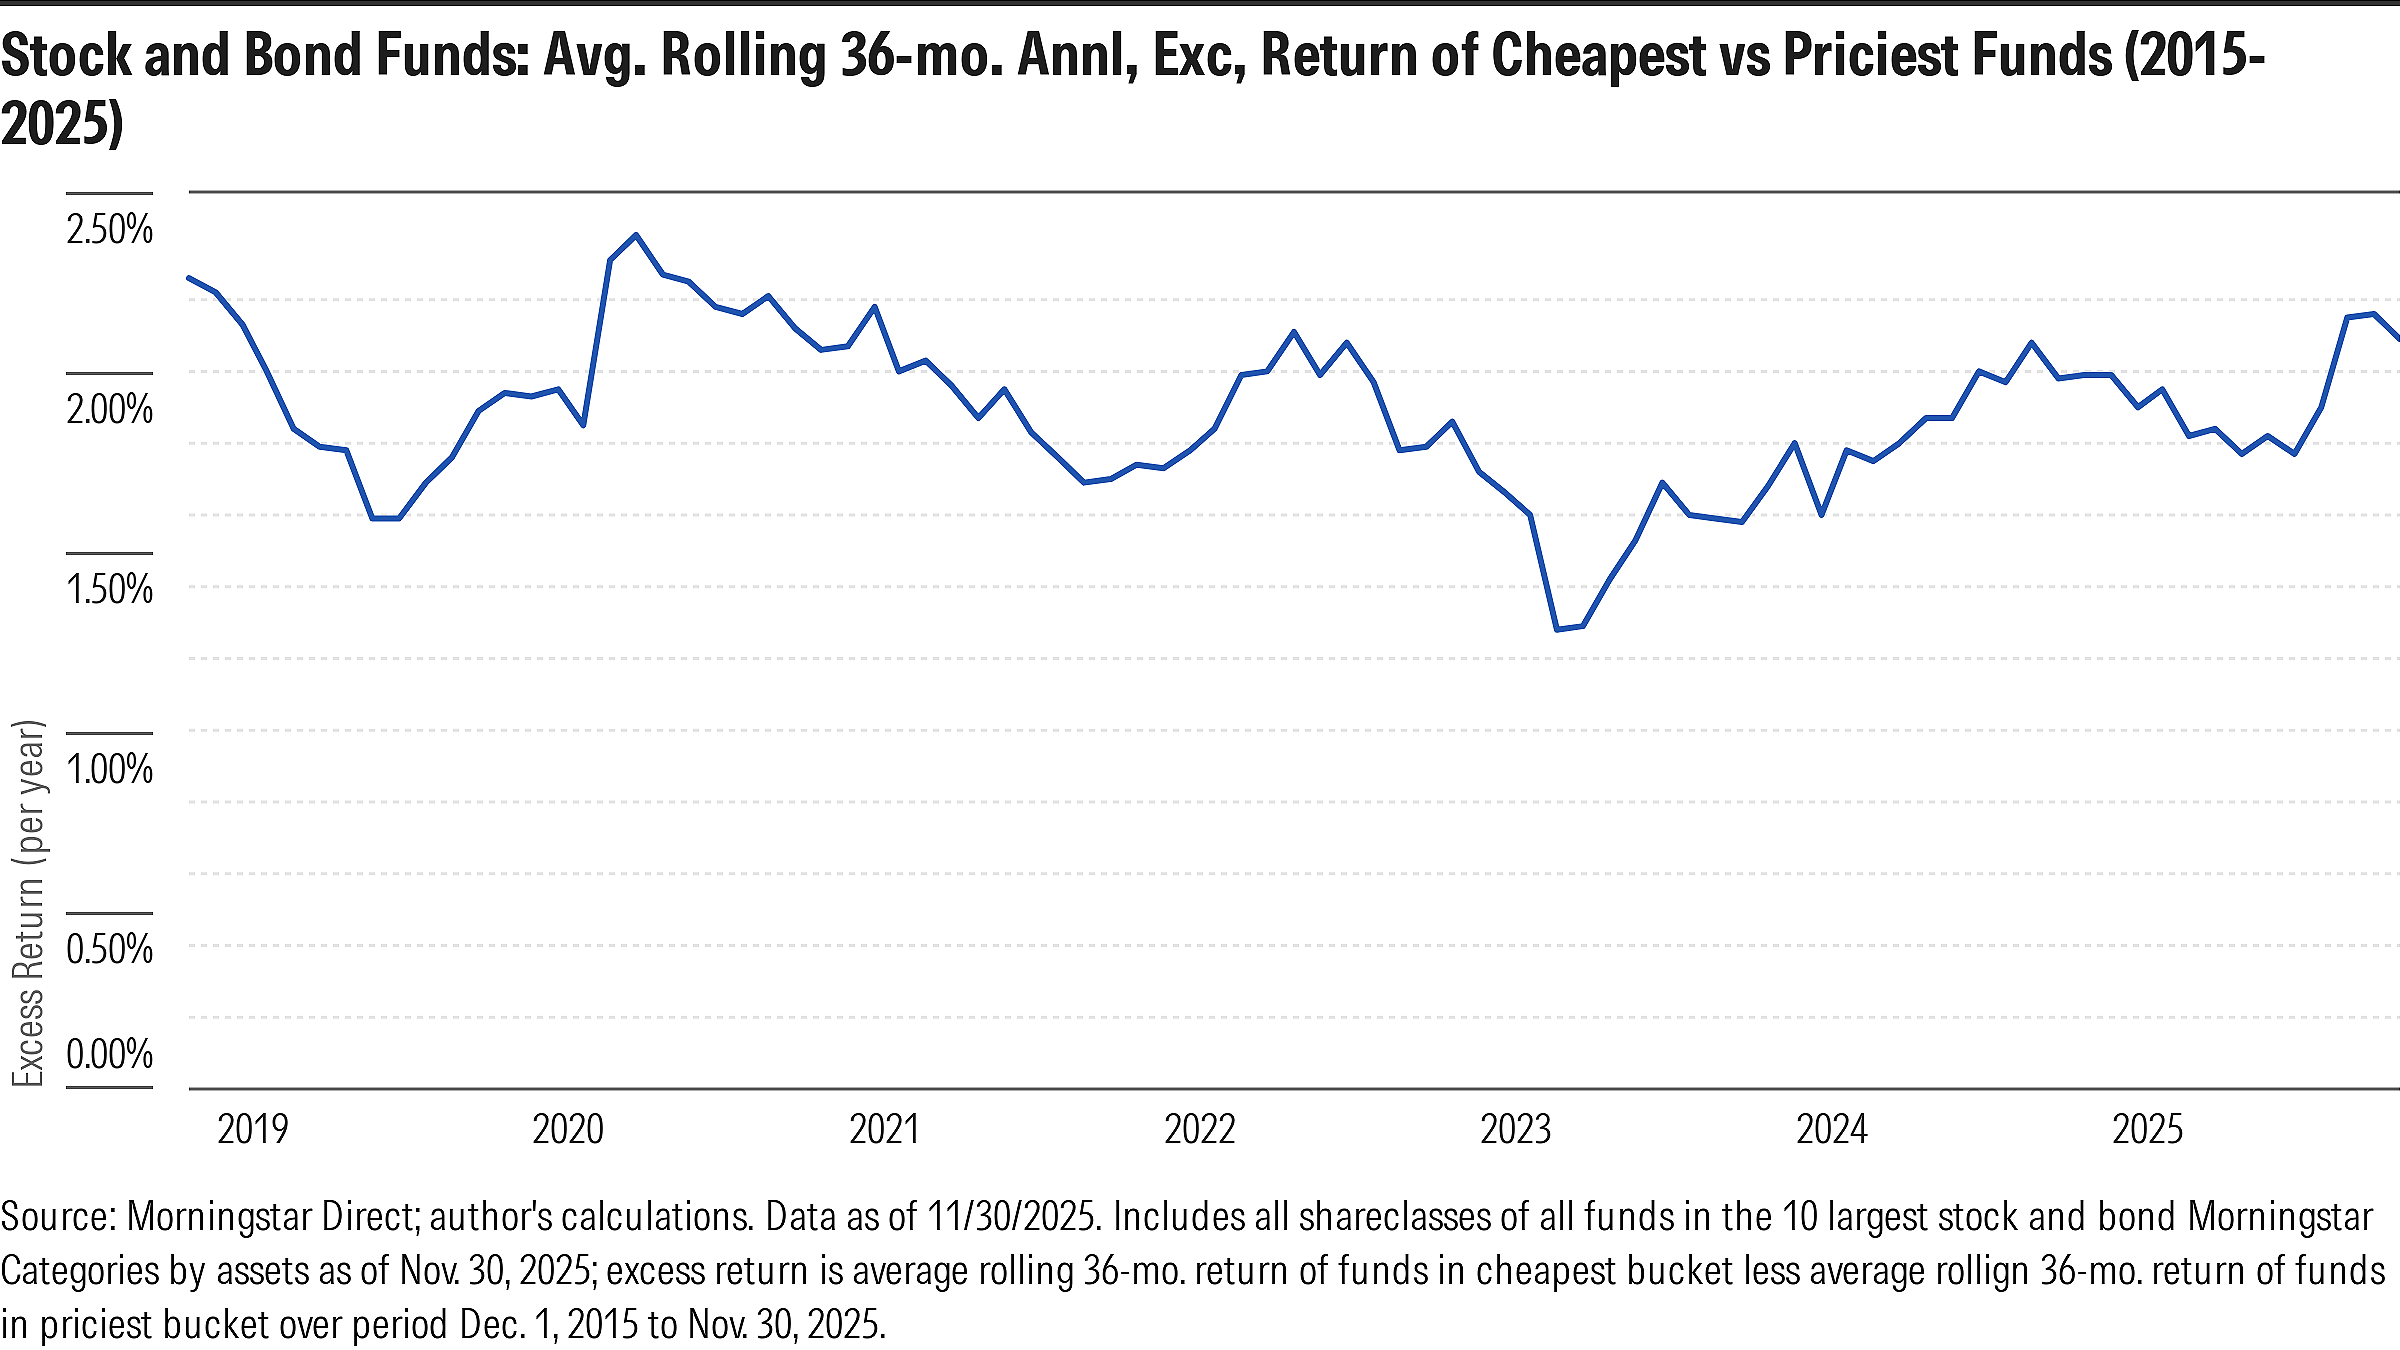
From there, what I thought I’d do is try to estimate how much of cheap funds’ outperformance stemmed from the fee advantage itself versus differences in pre-fee returns. To that end, I focused on the cheapest and priciest buckets, comparing their rolling average 36-month returns over the decade ended Nov. 2025.
Then I broke each rolling average excess return (i.e., cheapest bucket’s return minus priciest bucket’s return over thirty-six month period ended xx/xx/xxx, and so forth for the other rolling periods) into the fee difference and whatever was left over. I calculated the fee difference as the cost of the average fund in the cheapest bucket less the cost of the average fund in the priciest bucket as of the end of each rolling period.
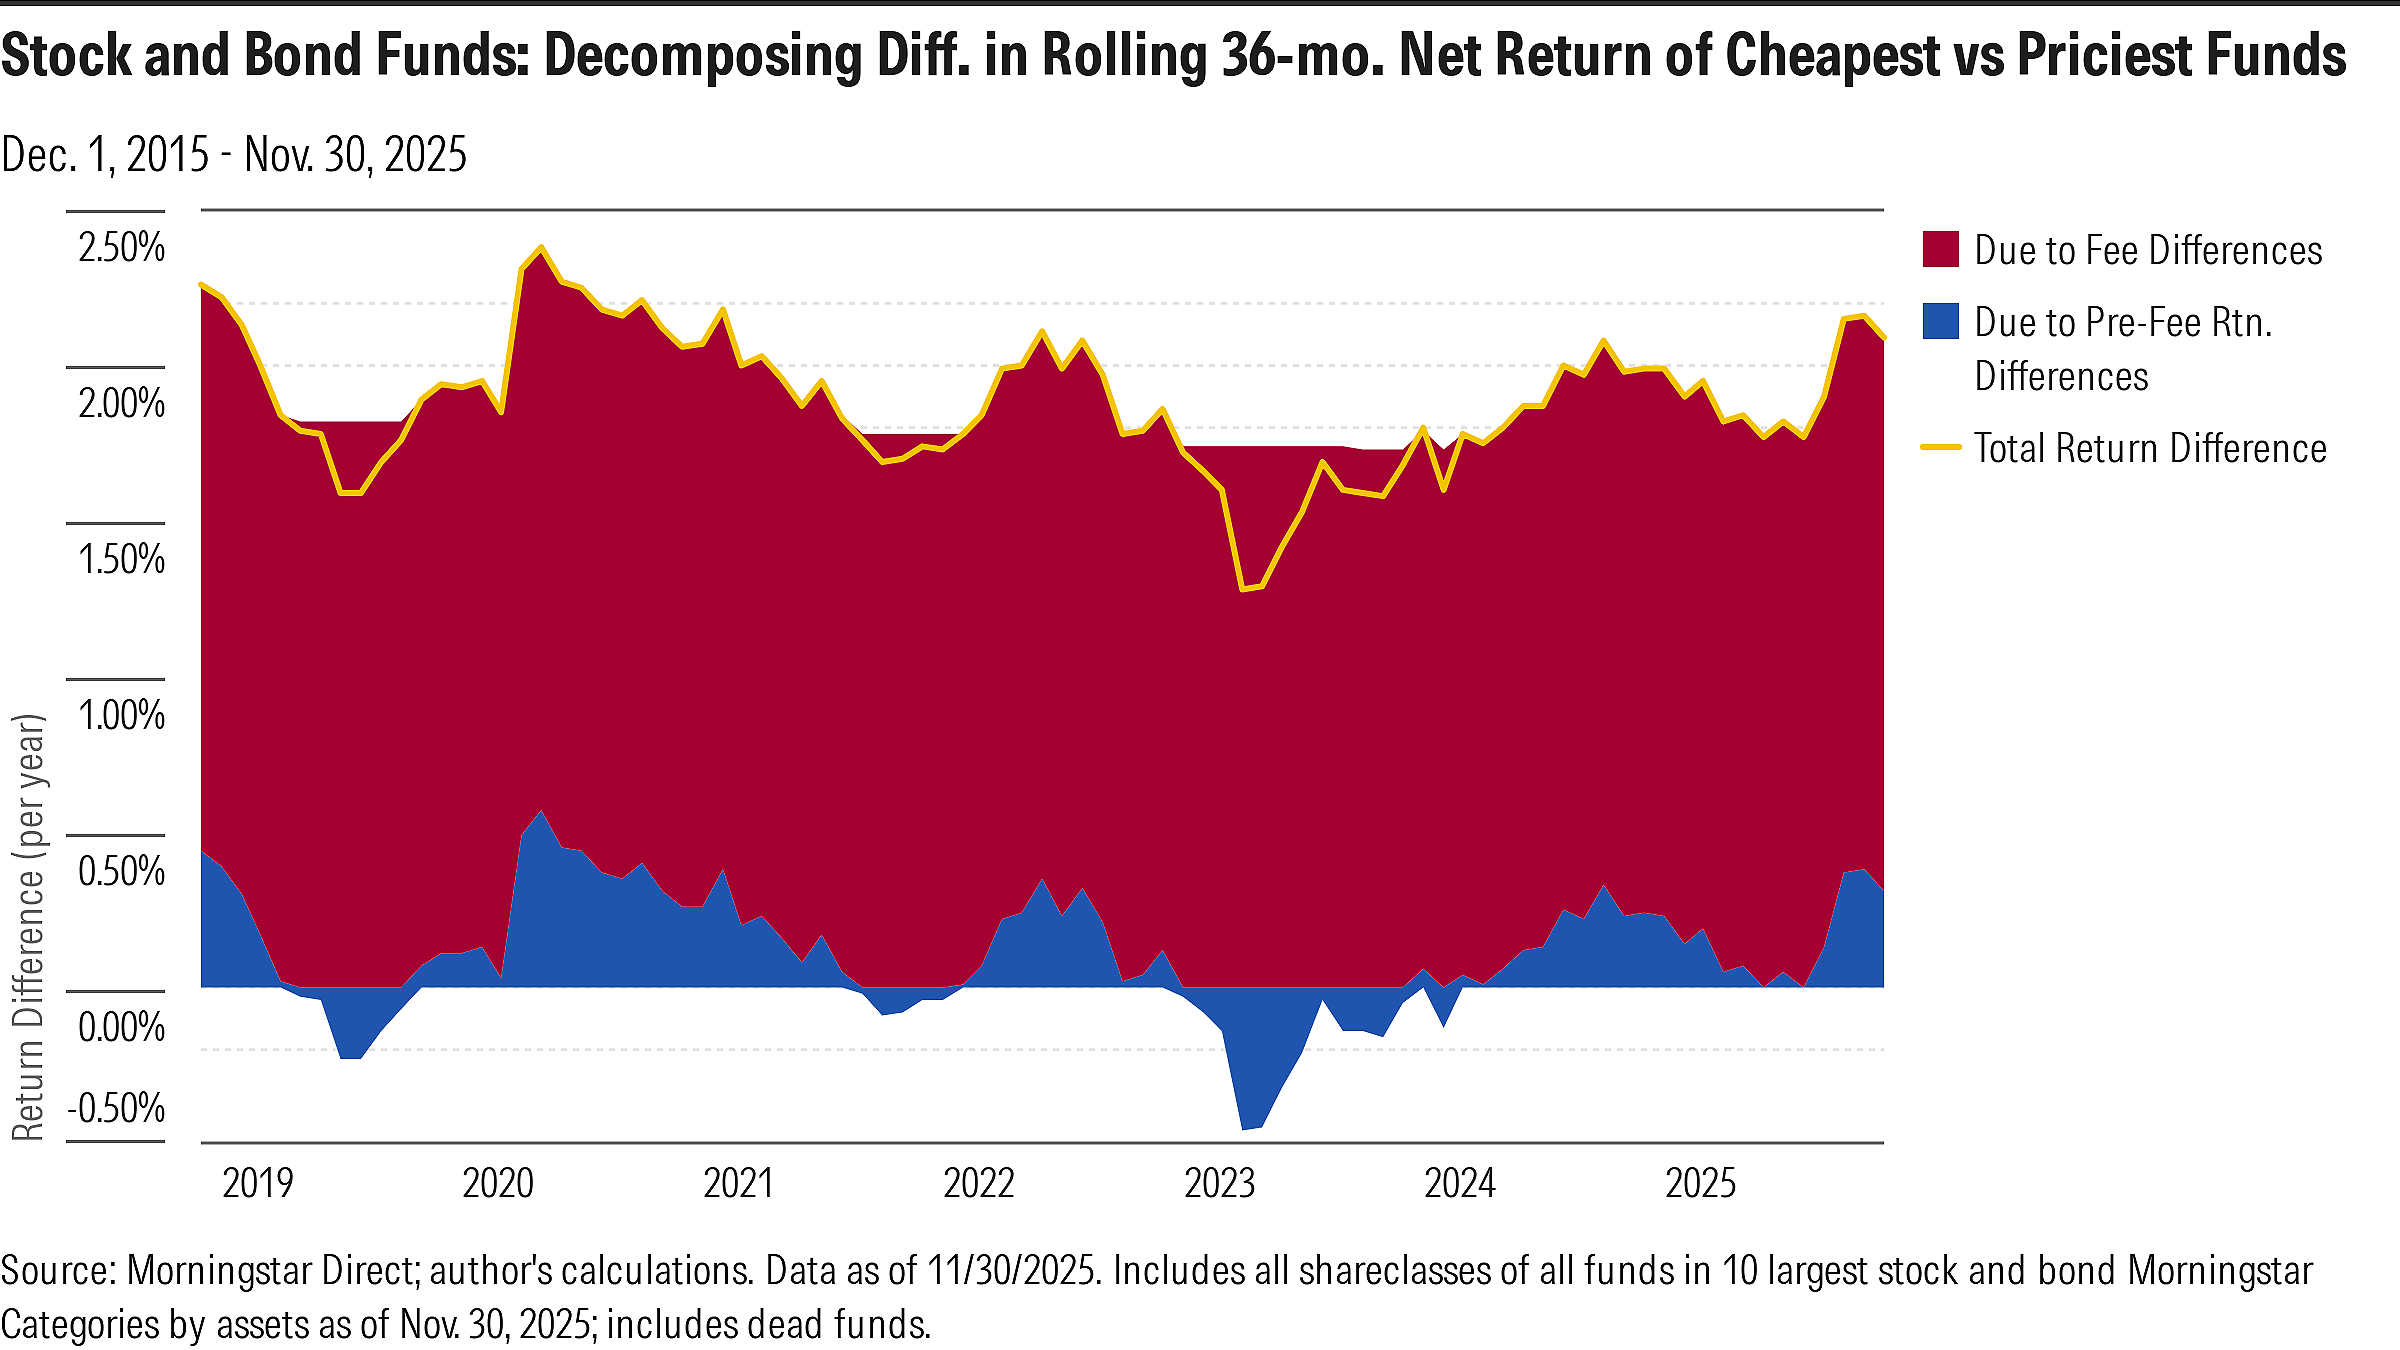
What you find is the fee difference (the red in the chart) explains nearly all the outperformance, with differences in pre-fee returns (the blue) a marginal factor.
The question is whether that represents a change from the past. To try to get a handle on that, I ran the same study for the immediately preceding decade ended Nov. 2015. Here’s what that picture looked like.
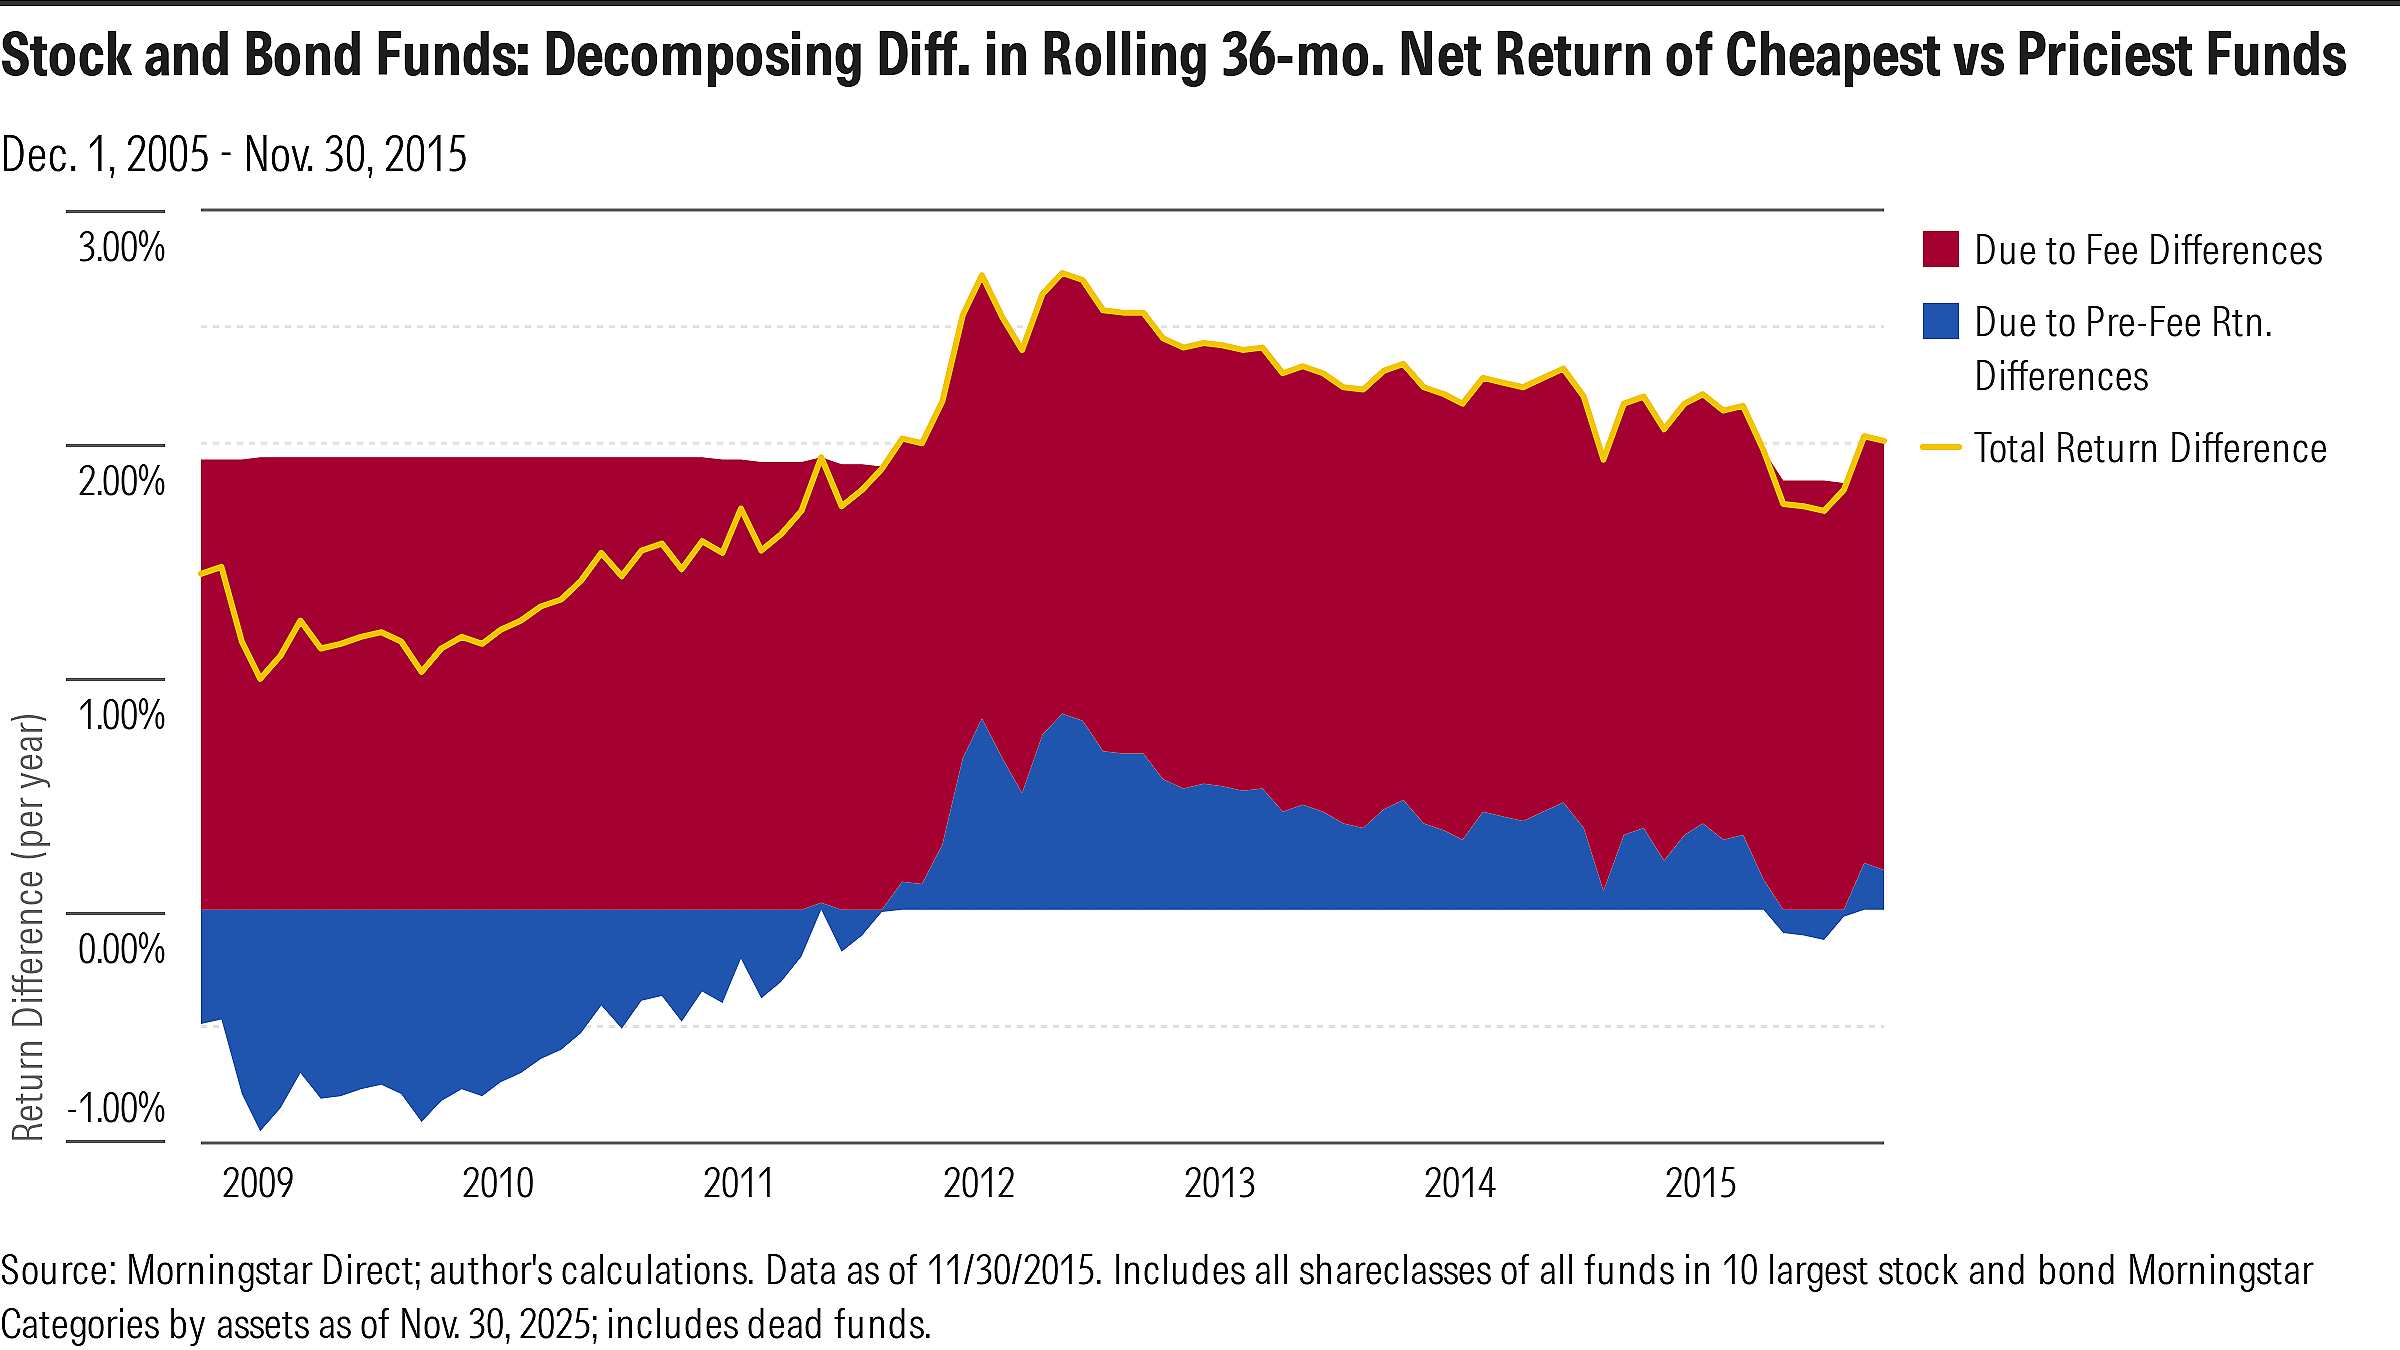
The ‘whatever was left over’ component—namely, differences in pre-fee returns (the blue)—was a much bigger factor in explaining the overall return difference in the prior decade. Put another way, while fees were predictive then, they weren’t as decisive as they’ve become in recent years. That is, fees appear to be getting stronger as a predictor of differences in funds’ performance.
I’ve got a pet theory on one of the trends that could be spurring that change, which I’ll expound on a bit in the forthcoming Morningstar.com article. But fwiw for now.
Not sure if this is my last post of the year but just in case wishing everyone happy holidays. Thanks for subscribing!
The views and opinions expressed in this blog post are those of Jeffrey Ptak and do not necessarily reflect those of Morningstar Research Services or its affiliates.
Here is a theory: Competition has increased among managers and products have proliferated. That leaves fees as the dominate way to add value.
The argument and evidence becomes even stronger if you perform a simple cost-benefit analysis using incremental risk-adjusted return and incremental correlation- adjusted cost. #ActiveManagementValueRatio #ActiveExpenseRatio