Death is a Drag
Funds get crushed. Then they get folded, short-circuiting mean reversion.

Michael Mauboussin and Dan Callahan of Morgan Stanley Counterpoint recently put out a really great paper analyzing the frequency and magnitude of drawdowns among stocks and funds. The upshot is deep drawdowns happen more often than you’d think and the top performers (with hindsight) are no strangers to big losses from the highs. I’m not doing it justice. Read the full study for more. You won’t be sorry.
Funds Get Crushed
Mauboussin and Callahan devote one section of the paper to U.S. stock mutual funds and naturally that piqued my interest. To sum it up, they found that the U.S. equity funds that had generated the highest returns from Jan. 1, 2000 to Dec. 31, 2024 had seen big drawdowns along the way. Here is the money table from the study:
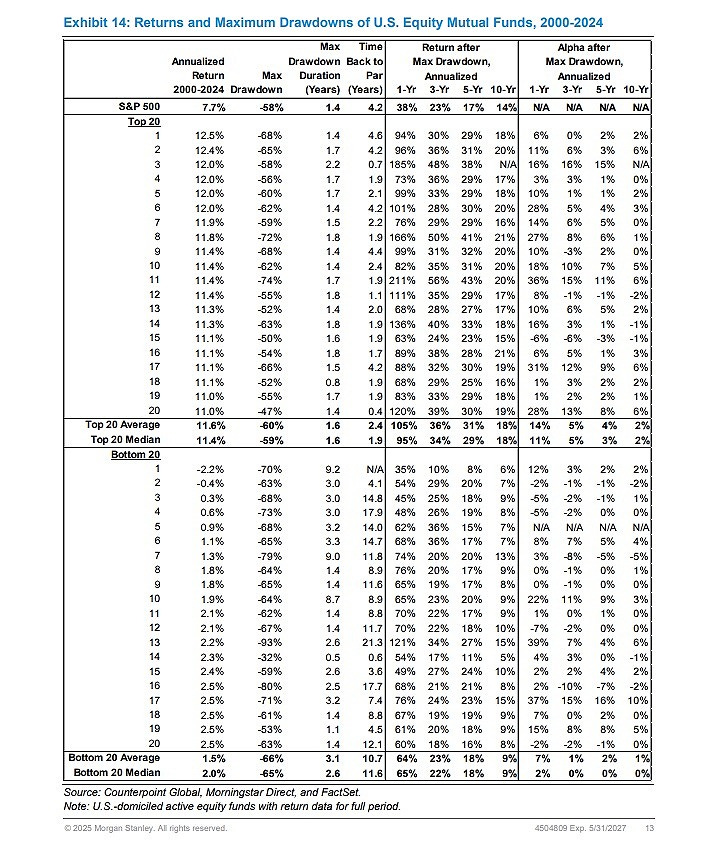
One of the things that makes funds different from individual stocks is what you might call ‘life-or-death agency risk’. To be clear, there’s agency risk with any investment - even someone that buys a Treasury courts it, as the U.S. government’s interests could diverge from bondholders’. The same goes for stocks, where management can respond to certain imperatives (like self-enrichment) to shareholders’ detriment.
Then They Get Folded
What makes funds a bit different, though, is that if they get crushed, the sponsoring fund company might decide to just pull the plug entirely.* This is a frequent occurrence: There were 1,939 active U.S. stock funds (oldest shareclass only) in existence on Jan. 1, 1998**. Of those, only 690 survived to Dec. 31, 2024, the rest being merged or liquidated. Here’s a breakdown of death rates by max drawdown.

At first glance, it’s surprising funds with smaller max drawdowns died at higher rates than those with deeper drawdowns. But that has a simple explanation: A fund would have had a smaller drawdown if it didn’t make it to the global financial crisis from 2007-2009. And so if a fund has a smaller max drawdown, it’s likely because it didn’t survive until the GFC, which by definition means it died and that, in turn, explains the high death rates for funds with smaller drawdowns.
The most common max drawdown range was -50% to -60% (733 funds), which makes sense considering the S&P 500 had a roughly 55% max drawdown during this period and many of the funds were large-cap oriented. 52% of these funds died, with the median merger/liquidation occurring around 3.5 years after they bottomed.
As the drawdowns got deeper, the odds of survival shrank. Only 42% of funds with a drawdown of -60% to -70% made it to the end; 65% of funds with a drawdown of -70% to -80% died; and of the relatively small number that saw a drawdown deeper than 80%, only one-quarter lived. All told, fewer than one-half of all funds that had a -50% or deeper drawdown survived. This is what I mean by ‘life-or-death agency risk’.
Short-circuit: Mean Reversion
True, some of the funds didn’t really die. They got merged into other funds that carried on and so it didn’t fully arrest compounding. But that brings up another issue: When one fund gets merged into another, the acquirer is usually the stronger performer of the two. And so in effect the merged fund’s beaten-down holdings are replaced with a set of slightly less downtrodden names.
To illustrate what I’m describing, I compiled the daily returns of all active U.S. stock funds that were alive on Jan. 1, 1998 and then recorded the dates when their maximum drawdown began and ended. Then I derived each fund’s cumulative return from its then-peak (i.e., when the drawdown began) through its last trading day or Dec. 31, 2024, whichever came later. So if a fund had a 50% drawdown from its peak and proceeded to earn 100% off the bottom, it would have reattained its prior high, for a 0% cumulative return. If it regained its prior high and kept going, then it would have earned a positive cumulative return and if it didn’t regain its previous high then it would have a negative cumulative return.
The results speak for themselves: On average, funds that were merged or liquidated earned far less after a drawdown than funds that survived. To illustrate, I’ve broken the results down by whether the fund was liquidated, merged into another U.S. equity fund, or merged into a different type of fund. For reference, I’ve also included the S&P 500 Index.
The S&P 500 Index earned a 429% cumulative return from its prior Oct. 14, 2007 high through Dec. 31, 2024. To break it down, it lost 55% from that Oct. 2007 peak through its Mar. 7, 2009 bottom but then proceeded to gain 1,067% cumulatively from that Mar. 2009 bottom through Dec. 31, 2024, for a 429% cumulative return.
The average active U.S. stock fund that survived the full Jan. 1, 1998 to Dec. 31, 2024 period earned a 283% cumulative return (268% median return) from the peak before its maximum drawdown. More than four in five of those funds had their maximum drawdown in 2009 like the S&P did. And yet they still lagged the benchmark by around 2% per year from their 2007 high through Dec. 2024.
Funds that merged or liquidated underperformed by an even wider margin. The average fund that merged into another U.S. equity fund gained only 190% cumulatively from its peak until Dec. 31, 2024 while those that merged into other types of funds saw just a 26% cumulative return, on average. Worst of all, the average fund that was liquidated didn’t even retake its previous high, suffering a cumulative 5% loss from its prior high. In fact, around two-thirds of funds that were liquidated failed to retake their previous highs.
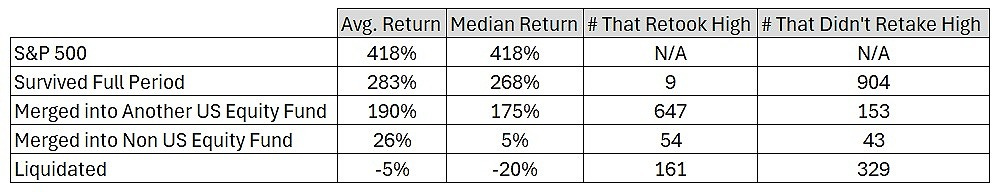
Given that these active funds could have had their maximum drawdowns at different times (depending on when they were mothballed; also, around 12% of the funds that survived the whole period had their max drawdown in 2002), I further subdivided the analysis to group funds based on when they had their max drawdown, focusing on the calendar years 2002 and 2009. Here is 2002:

It’s a similar pattern to what we saw before. The S&P gained a cumulative 512%*** while the average surviving active U.S. stock fund gained substantially less (+318%). The average fund that merged into another U.S. equity fund gained only 154% cumulatively while funds acquired by other types of funds earned only a 17% cumulative return. The average liquidated fund finished the period 24% below its previous high, with more than four-in-five failing to retake their prior peak.
And then here’s 2009:
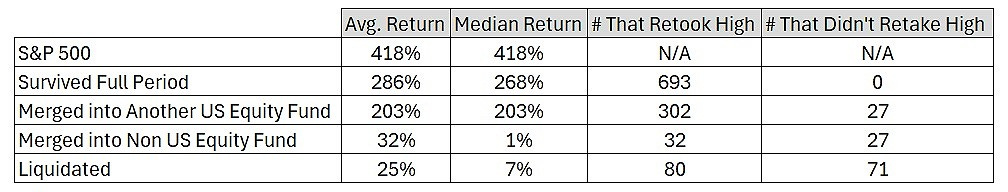
The results didn’t look too different. Surviving active funds gained less than the S&P (286% average cumulative return), merged funds less than that (203% for those acquired by other U.S. stock funds; 32% for those merged into non-U.S. equity funds), and liquidated funds even less than that (25% cumulative return).
Conclusion
To sum up, the deeper the drawdown, the likelier funds are to kick the bucket. When funds get merged or liquidated away, it can short-circuit mean reversion, keeping them from recovering ground they’d formerly lost.
This short-circuiting owes to a few factors, one obvious (if you liquidate, you’ve thwarted compounding), one more subtle (mergers are often made to tidy up lineups so the better performer is the acquirer), and a third unaddressed here. I’ll tackle that third factor—career risk—in a proper Morningstar.com article in the near future. For now, hope you find this useful.
A huge thanks to Michael Mauboussin and Dan Callahan for their terrific study, which sparked this analysis.
Footnotes
* I know there are life-or-death agency risks that also apply to publicly-traded stocks. For instance, management and the board might accept a low-ball offer to take the firm private for pecuniary reasons. That said, there are far fewer barriers to mothballing a fund. For instance, you are not going to be looking at a class-action suit on behalf of restive shareholders in fund’ville.
** I started the clock on Jan. 1, 1998, not Jan. 1, 2000 like Mauboussin and Callahan did, because in that way I could capture more of the drawdown that some funds would have experienced amid the dot com bust. Some of those funds began their drawdowns before 2000, so this yielded a fuller picture.
***As previously mentioned, the S&P’s max drawdown for the Jan. 1, 1998 to Dec. 31, 2024 period occurred between Oct. 2007 and Mar. 2009. For purposes of the analysis below, I calculated the S&P’s cumulative return from Sept. 4, 2000 through Dec. 31, 2024, as Sept. 4 was the index’s high before it entered a prolonged drawdown that concluded in Oct. 2002.
The views and opinions expressed in this blog post are those of Jeffrey Ptak and do not necessarily reflect those of Morningstar Research Services or its affiliates.