Cut It Out
Assessing how a strategy of avoiding the top-performing sector would have done

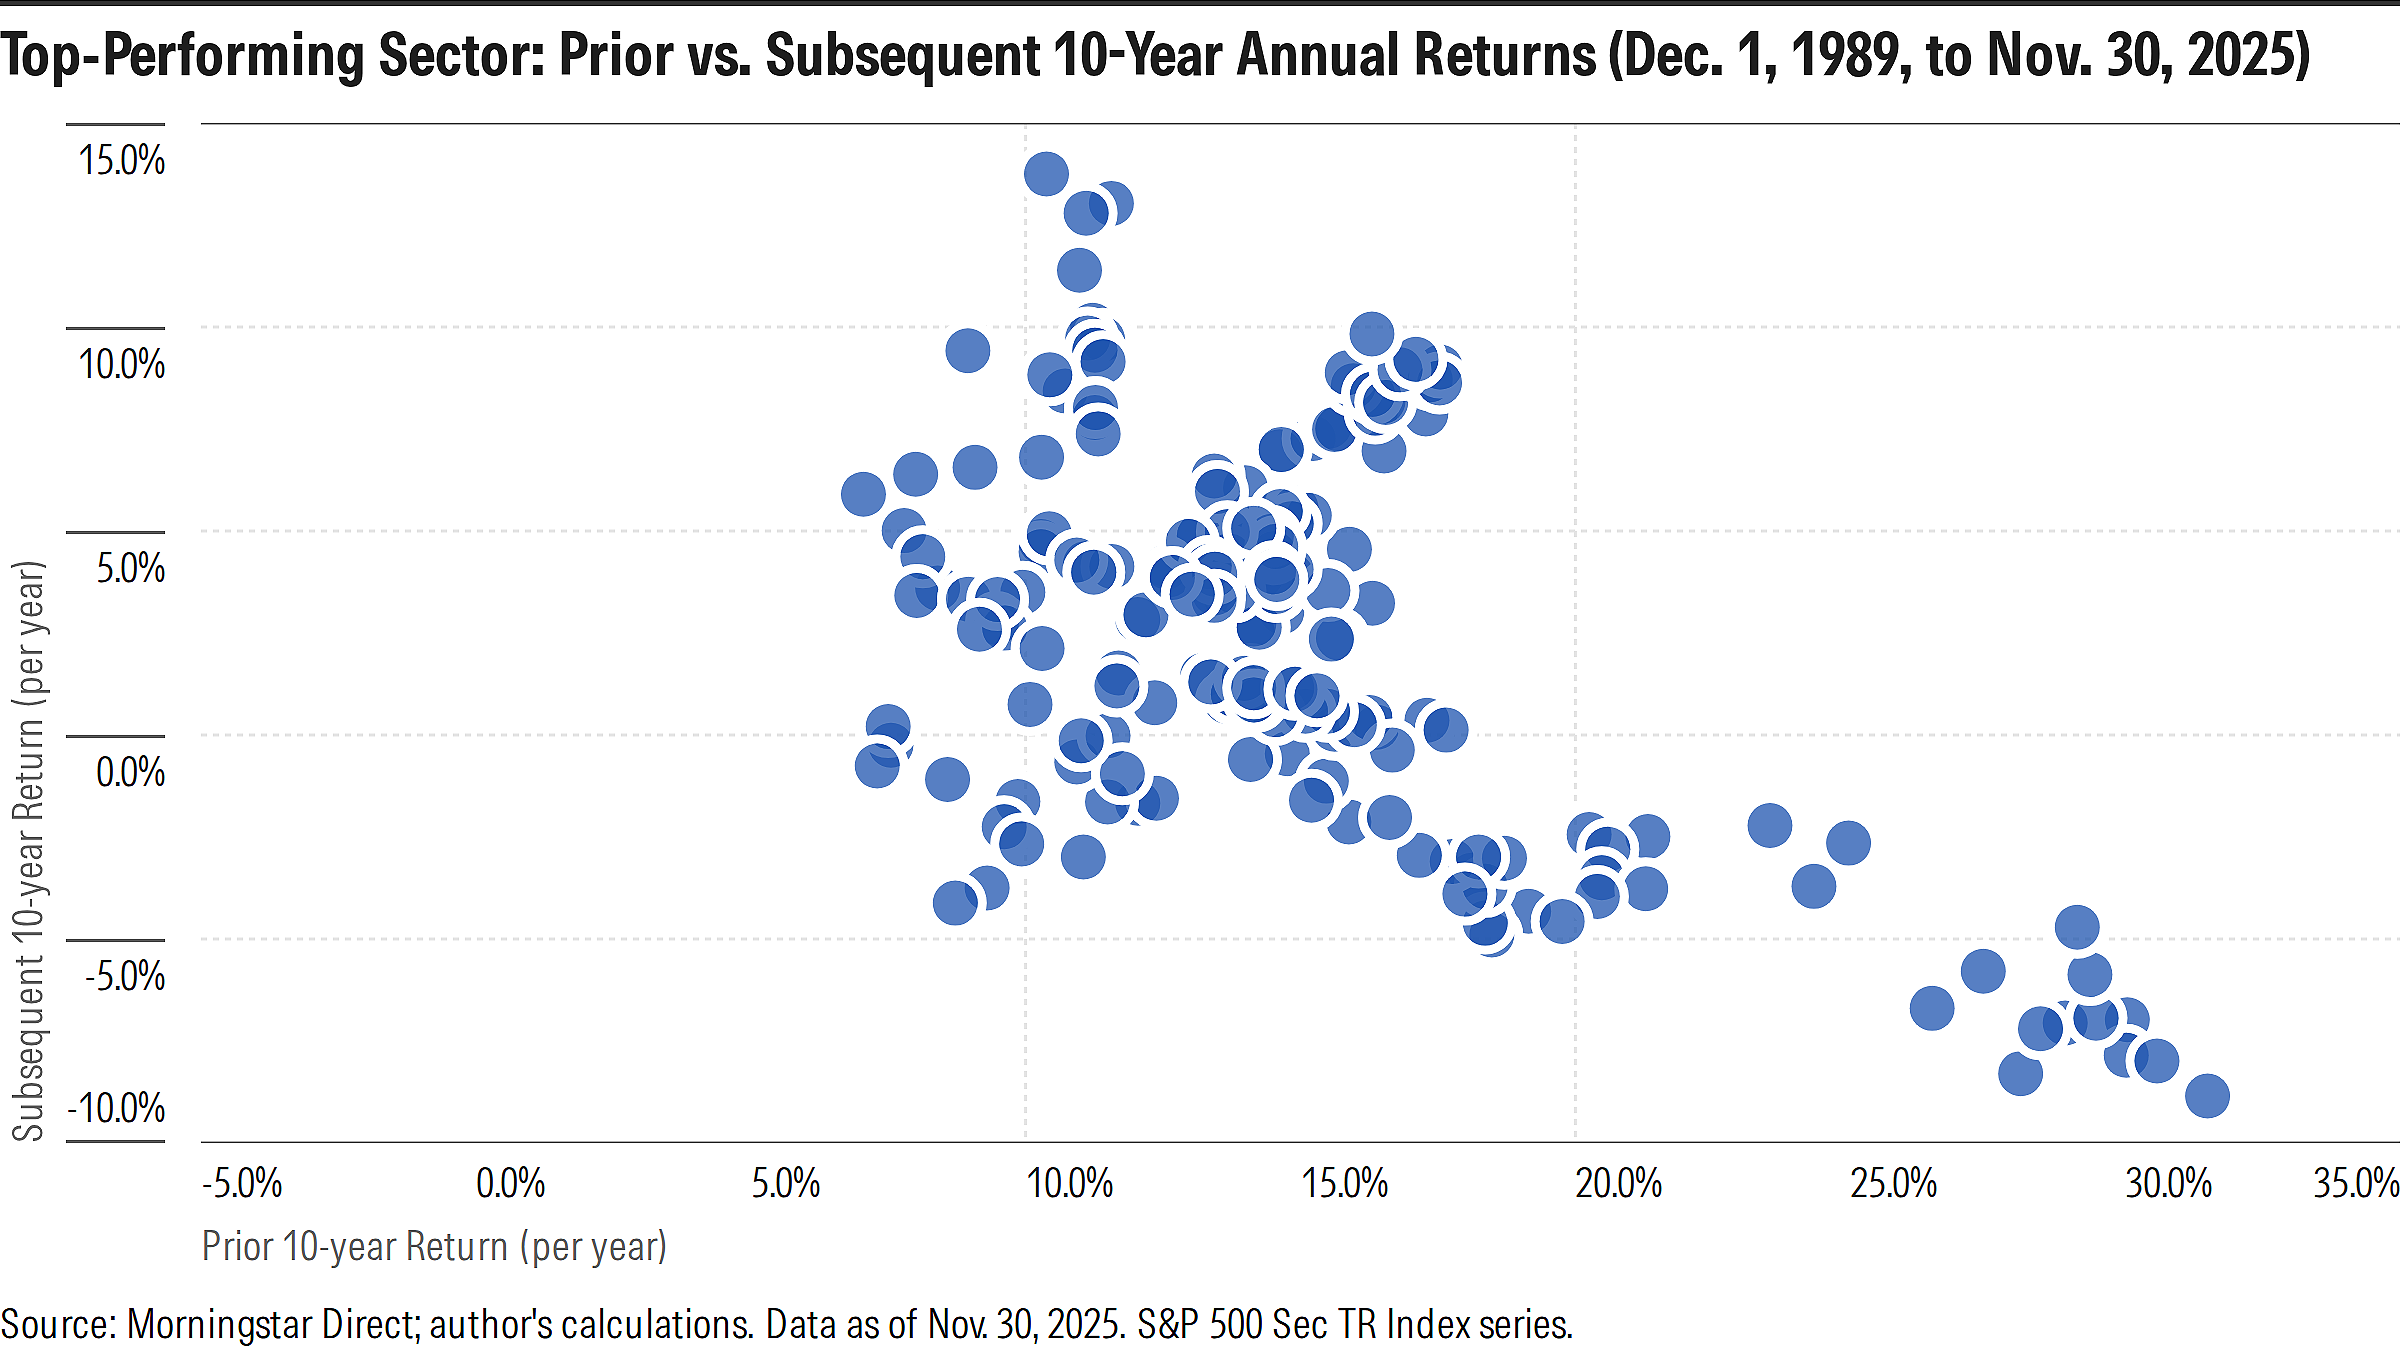
I recently wrote a piece for Morningstar.com in which I examined the subsequent performance of the S&P’s 500’s highest-returning sectors since 1989. Long story short, leading sectors struggled in the years that followed the decade where they posted the best returns. Moreover, when the leading sector gained 20%+ over a decade, it lost money in every subsequent 10-year period.
Avoidance as a Strategy
What I didn’t explore, though, was the corollary: How you’d have done if you systematically avoided the leading sector after its run of dominance. So I’ll focus on that in this post.
One question is how one “systematically avoids” the leading sector. The approach I took mirrors the study I ran in the Morningstar.com piece: You tally-up every S&P 500 sector’s return over all rolling 10-year periods, and whichever did the best over a rolling period, you avoid it for the next 10 years, redistributing its weight to all the other sectors pro-rata.
Since the study began in 1989 (the year the S&P 500 sector indexes incepted), it meant there were seven starting calendar years (1989 – 1995) where you’d be able to test the strategy over two complete non-overlapping 10-year periods.
For instance, the sectors’ returns over the Dec. 1, 1989 – Nov. 30, 1999 period determined which sector had led that decade and so then I measured the performance of the S&P ex that leading sector over the subsequent decade ended Nov. 30, 2009. I repeated this for the decade ended Nov. 30, 2019, measuring the S&P’s performance ex the sector that had led over the 10 years ended Nov. 30, 2009. And so forth for the periods beginning Dec. 1 of the 1990 through 1995 calendars.
Easy Peasy
Here’s how this ex-leading-sector approach would have worked over the twenty-year periods ended Nov. 30 of 2019, 2020, 2021, 2022, 2023, 2024, and 2025. I’ve compared that hypo’s performance to the returns of the leading sector (that was excluded) as well as the standard S&P 500 index.
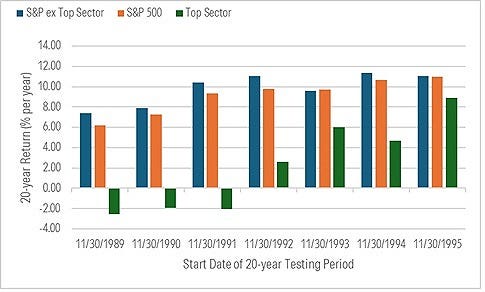
The ex-leading-sector hypo would have outgained the S&P in six of these seven twenty-year periods, not to mention the leading sector, which it trounced every time.
What about volatility of returns? The hypo fared well on that count, too.
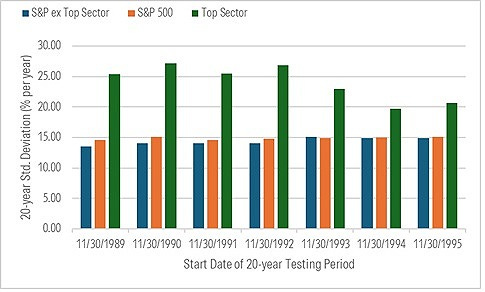
It was less volatile than the S&P in all but one of the twenty-year periods. By contrast, the leading sector exhibited much higher volatility than either the hypo or the S&P.
Taken together, that translated to strong risk-adjusted returns for the ex-leading sector hypo.
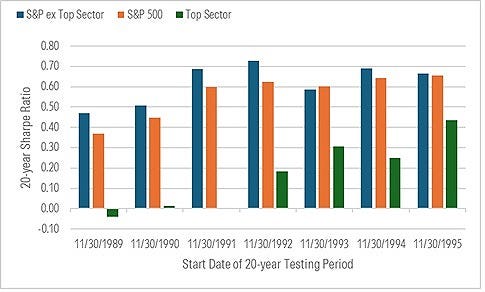
It would have earned a higher Sharpe Ratio than the S&P over six of the seven twenty-year periods I mentioned. The leading sector posted dismal risk-adjusted returns.
Needless to say, this is interesting: It appears you could have achieved superior performance by simply avoiding the leading sector. This doesn’t demand prescience. You just look back and exclude whatever did best. Easy peasy.
Well, Not That Easy
That said, some big caveats apply:
While the leading sector is immediately knowable, the future obviously isn’t and in this case we’re talking about the next ten years, which is going to be too long for some (ok many) to stick with. So if the hypo strategy of avoiding the leading sector boasts simplicity, it requires patience. Lots of it.
It’s probably best thought of as point-to-point/hands-off strategy vs. something you’d frequently adjust along the way. For instance, if you were reconstituting each month-end to remove whatever had become the leading sector over the 10 years just ended, you potentially could be re-adding the former leading sector before it reverts lower (one of the things I observed in the Morningstar.com article is the leading sector often kept chugging along even into the following decade, before faltering).
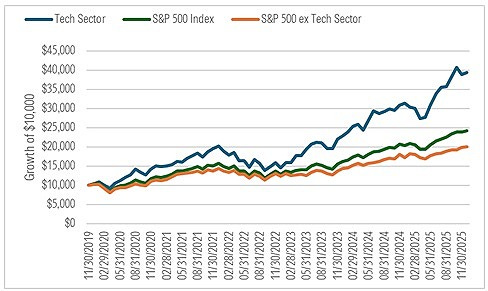
We’re not done yet. I measured the performance over twenty-year periods ended Nov. 30. of 2019 through 2025. But in the case of the hypo portfolio that began on, say, Nov. 30, 1999, there’s another test that’s still running: The hypo that excluded the leading S&P sector over the decade ended Nov. 30, 2019. That hypo began to exclude the tech sector on Dec. 1, 2019 and in the time since it’s lagged the S&P. Why? Tech has shown no signs of slowing down yet.
Lastly, the hypo acquitted itself well but it’s not like the S&P got smoked. The hypo beat it by only around 70 basis points per year, on average, over the seven twenty-year periods I measured. And keep in mind the S&P was hauling around the full weight of the formerly-top sector, whose poor returns dragged on its performance. Despite that, other sectors stepped up to the plate, buoying returns. Yes, it still lagged, especially risk-adjusted, but it wasn’t a total blowout. There’s a lesson in that.
Happy holidays and thanks to all who follow this Substack.
The views and opinions expressed in this blog post are those of Jeffrey Ptak and do not necessarily reflect those of Morningstar Research Services or its affiliates.
How about a bottom line? Are we supposed to slice and dice and guess? My takeaway is to own an S&P or Total US market ETF along with a Treasury ladder or total bond ETF and total international ETF. Rebalance annually. Do well. Sleep well.
I wonder, in the spirit of mean reversion, how adding more to the lagging sector from the leading would affect results. Sector cap sizes are vastly different, so some reasonable adjustments must be assumed