

A Lot of Dough
Investors in Vanguard Total Stock Market Index Fund have been absolutely raking it in.

I tend to write in this space about stuff that’s gone wrong, could go better, or is just kind of weird. For this one I’ll change it up a a bit to focus on what looks like a bona fide success story.
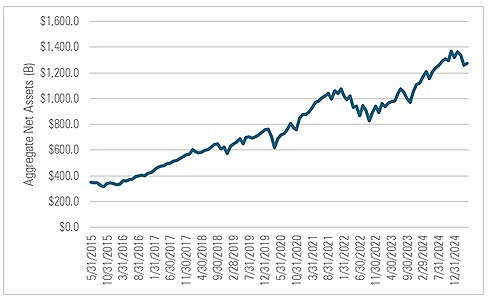
Vanguard Total Stock Market Index Fund is enormous. It recently held $1.7 trillion in net assets, which I believe makes it the largest fund ever in dollar terms.
When funds get massive like that, it can bode ill for future returns. That can be because the asset class got overheated, investors got carried away, the manager had more money than he could handle, or a little of everything.
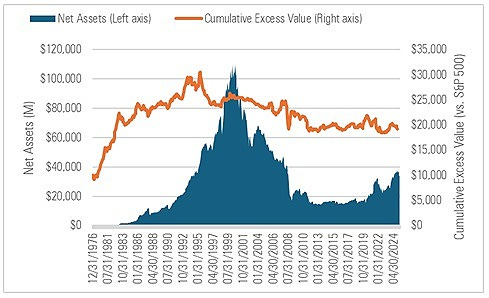
Fidelity Magellan is maybe the poster child for this. It delivered standout returns through the mid-1990s, saw a torrent of inflows, then hit a wall. You can see it in this chart, which time lapses the fund’s asset growth (left axis) and the cumulative value it added versus the S&P 500 (right axis). When the line rose, the fund was beating the S&P and the opposite when it fell. The line started falling as assets neared their peak.
But it’s been a different story for Vanguard Total Stock Market Index Fund. In April 2022, it had more than $930 billion in assets spread across its open-end fund shareclasses. (I’m excluding the ETF class for a reason I explain in a footnote* below.) That made it the largest fund at the time.
How’s it done in the three years since? Pretty well. It gained 11.3% per year. (This is the total return of its five open-end shareclasses weighted by their starting assets.) But what’s remarkable is its investors have also gained 11.3% per year: The fund’s dollar-weighted return—which accounts for the timing and magnitude of cash flows to approximate the return of the average dollar—virtually matches its total return.
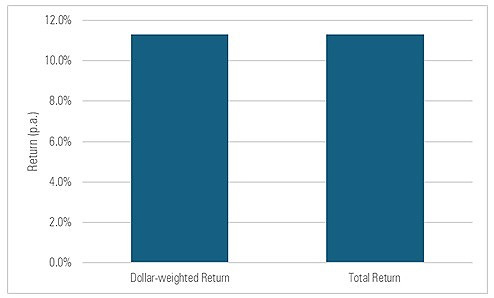
Investors don’t typically capture all of their funds’ total returns. It’s usually less than that. So for them to do that on the largest fund to ever exist—by my estimates it’s translated to $350 billion-plus in income and gains—is really quite something.
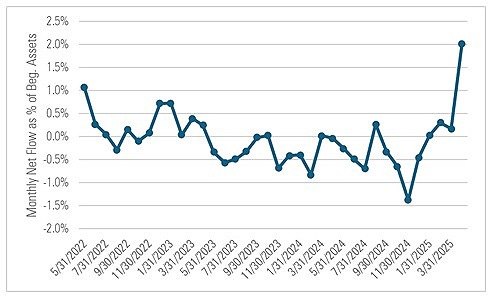
How’d they manage it? While there was definitely some buying and selling going on, it didn’t really amount to that much. Here are the monthly flows over the three years ended Apr. 30, 2025, measured as a percentage of the fund’s starting assets. Until recently, the monthly flows were +/- 0.5% of net assets. Thus, most of the assets remained in place from one month to the next, earning the fund’s total return.
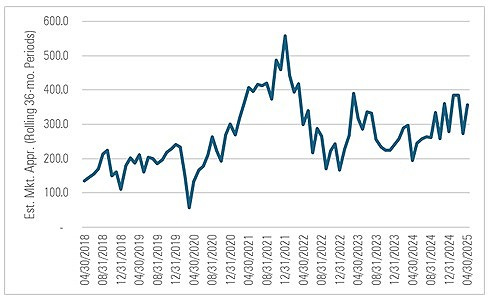
What’s wild is this doesn’t even appear to be a record haul for investors in the fund. Back of the envelope, it looks like there were other three-year periods where investors saw even larger dollar returns.
To sum up: No, the fund’s investors didn’t make life-changing money over this recent three-year period. Yes, it’s a short time frame and it’s not like the fund did a moonshot. And, no, it’s not out of the question that the market could turn or investors could badly err. But still. $350 billion is a lot of dough.
* I’ve excluded the ETF shareclass for a few reasons. First, we don’t calculate a dollar-weighted return for ETFs like we do for open-ends. Second, though I could easily estimate it manually (it’s a standard XIRR calc in Excel), there can be a bit of intricacy depending on assumptions one makes regarding dividend reinvestments. Third, the ETF class might be a different kettle of fish, as there are indications people trade ETFs more often than they do open-end share classes.
The views and opinions expressed in this blog post are those of Jeffrey Ptak and do not necessarily reflect those of Morningstar Research Services or its affiliates.
Jeff, please see this article: https://www.advisorperspectives.com/articles/2025/07/14/trial-barry-ritholtz. It has a simple, elegant refutation of the “mind the gap” methodology that Morningstar uses. (At least I find it persuasive.). Please let me know what you think.